CNSBD can be used as a fuel without any modification in existing CI engine.
Pentanol reduces HC, CO, NOx and Smoke emissions significantly.
New and next generation alternative fuel is employed.
Blending of CNSBD with pentanol resulted in no separation of phases and found miscible.
This work investigates the effect of adding pentanol with biodiesel derived from cashew nut shell on its emissions characteristics is conducted in stationery diesel engine. The main purpose of this work is intended to reduce the emissions by fuelling biodiesel derived from cashew nut shell and the pentanol blends. Cashew nut shell biodiesel is prepared by transesterification process. Oxygenated additive used in the work is Pentanol. The experiment is conducted using four test fuels such as, biodiesel derived from cashew nut shell (CNSBD), a fuel containing 90% cashew nut shell biodiesel and 10% pentanol (CNSBD90P10), a fuel containing 80% cashew nut shell biodiesel and 20% pentanol (CNSBD80P20) and neat diesel. Experimental work concluded that by adding 10% of pentanol to cashew nut shell biodiesel 10.1%, 2.6%, 5.1% and 2.1%reduction in CO, HC, NOx and Smoke emissions were observed respectively. Further by fueling with these blends, no modifications in engines were required.

The distribution of NOx- and VOC-sensitive regimes in the PRD are identified.
The effectiveness of six popular chemical indicators for discriminating O3 sensitivity regimes is evaluated.
Threshold levels for HCHO/NOy, H2O2/HNO3, O3/NOy, O3/NOz, O3/HNO3 were derived and verified.
The indicators H2O2/HNO3 and H2O2/NOz performed best and maintained relatively stable threshold levels.
Surface O3 production has a highly nonlinear relationship with its precursors. The spatial and temporal heterogeneity of O3-NOx-VOC-sensitivity regimes complicates the control- decision making. In this paper, the indicator method was used to establish the relationship between O3 sensitivity and assessment indicators. Six popular ratios indicating ozone-precursor sensitivity, HCHO/NOy, H2O2/HNO3, O3/NOy, O3/NOz, O3/HNO3, and H2O2/NOz, were evaluated based on the distribution of NOx- and VOC-sensitive regimes. WRF-Chem was used to study a serious ozone episode in fall over the Pearl River Delta (PRD). It was found that the south-west of the PRD is characterized by a VOC-sensitive regime, while its north-east is NOx-sensitive, with a sharp transition area between the two regimes. All indicators produced good representations of the elevated ozone hours in the episode on 6 November 2009, with H2O2/HNO3 being the best indicator. The threshold sensitivity levels for HCHO/NOy, H2O2/HNO3, O3/NOy, O3/NOz, O3/HNO3, and H2O2/NOz were estimated to be 0.41, 0.55, 10.2, 14.0, 19.1, and 0.38, respectively. Threshold intervals for the indicators H2O2/HNO3, O3/NOy, O3/NOz, O3/HNO3, and H2O2/NOz were able to identify more than 95% of VOC- and NOx-sensitive grids. The ozone episode on 16 November 16 2008 was used to independently verify the results, and it was found that only H2O2/HNO3 and H2O2/NOz were able to differentiate the ozone sensitivity regime well. Hence, these two ratios are suggested as the most appropriate indicators for identifying fall ozone sensitivity in the PRD. Since the species used for indicators have seasonal variation, the utility of those indicators for other seasons should be investigated in the future work.

• Chemical actinometer (CA) was built for NO2 photolysis frequency, j(NO2), analysis.
• CA data (10% accuracy) were compared with spectroradiometer (SR) data.
• Long-term j(NO2) measurement was validated by comparison of CA and SR.
• Dis-benefit of aerosol on j(NO2) due toparticulate matter (PM2.5) control on O3.
The photolysis frequency of NO2, j(NO2), is an important analytical parameter in the study of tropospheric chemistry. A chemical actinometer (CA) was built to measure the ambient j(NO2) based on a high precision NOx instrument with 1 min time resolution. Parallel measurements of the ambient j(NO2) by using the CA and a commercial spectroradiometer (SR) were conducted at a typical urban site (Peking University Urban Environmental Monitoring Station) in Beijing. In general, good agreement was achieved between the CA and SR data with a high linear correlation coefficient (R2 = 0.977) and a regression slope of 1.12. The regression offset was negligible compared to the measured signal level. The j(NO2) data were calculated using the tropospheric ultraviolet visible radiation (TUV) model, which was constrained to observe aerosol optical properties. The calculated j(NO2) was intermediate between the results obtained with CA and SR, demonstrating the consistency of all the parameters observed at this site. The good agreement between the CA and SR data, and the consistency with the TUV model results, demonstrate the good performance of the installed SR instrument. Since a drift of the SR sensitivity is expected by the manufacturer, we propose a regular check of the data acquired via SR against those obtained by CA for long-term delivery of a high quality series of j(NO2) data. Establishing such a time series will be invaluable for analyzing the long-term atmospheric oxidation capacity trends as well as O3 pollution for urban Beijing.

Seasonal and spatial distribution of PM2.5 and its component were shown.
Local source profiles of major PM2.5 sources were developed.
Source apportionment was conducted using CMB model.
Inorganic secondary components is the biggest contribution at Xiamen.
Ambient PM2.5 samples were collected at four sites in Xiamen, including Gulangyu (GLY), Hongwen (HW), Huli (HL) and Jimei (JM) during January, April, July and October 2013. Local source samples were obtained from coal burning power plants, industries, motor vehicles, biomass burning, fugitive dust, and sea salt for the source apportionment studies. The highest value of PM2.5 mass concentration and species related to human activities (SO42–, NO3–, Pb, Ni, V, Cu, Cd, organic carbon (OC) and elemental carbon (EC)) were found in the ambient samples from HL, and the highest and lowest loadings of PM2.5 and its components occurred in winter and summer, respectively. The reconstructed mass balance indicated that ambient PM2.5 consisted of 24% OM (organic matter), 23% sulfate, 14% nitrate, 9% ammonium, 9% geological material, 6% sea salt, 5% EC and 10% others. For the source profiles, the dominant components were OC for coal burning, motor vehicle, biomass burning and sea salt; SO42– for industry; and crustal elements for fugitive dust. Source contributions were calculated using a chemical mass balance (CMB) model based on ambient PM2.5 concentrations and the source profiles. GLY was characterized by high contributions from secondary sulfate and cooking, while HL and JM were most strongly affected by motor vehicle emissions, and biomass burning and fugitive dust, respectively. The CMB results indicated that PM2.5 from Xiamen is composed of 27.4% secondary inorganic components, 20.8% motor vehicle emissions, 11.7% fugitive dust, 9.9% sea salt, 9.3% coal burning, 5.0% biomass burning, 3.1% industry and 6.8% others.

Natural disasters cause considerable property damage and loss of life as well as destruction of ecosystem and natural resources. In the context of global change, extreme events are expected to increase in both frequency and intensity. To prevent natural disasters and mitigate the loss, we need to act quickly and effectively. It would be conducive to achieve sustainable economic development, reduce disaster vulnerabilities and risks, and build resilience through implementing effective measures of disaster prevention, preparedness, response, and recovery.
Incorporating the missing heterogeneous oxidation of S(IV) by NO2 into the WRF-Chem model.
Sulfate production is not sensitive to increase in SO2 emission.
The newly added reaction reproduces sulfate concentrations well during winter haze.
We implemented the online coupled WRF-Chem model to reproduce the 2013 January haze event in North China, and evaluated simulated meteorological and chemical fields using multiple observations. The comparisons suggest that temperature and relative humidity (RH) were simulated well (mean biases are -0.2K and 2.7%, respectively), but wind speeds were overestimated (mean bias is 0.5 m?s−1). At the Beijing station, sulfur dioxide (SO2) concentrations were overpredicted and sulfate concentrations were largely underpredicted, which may result from uncertainties in SO2 emissions and missing heterogeneous oxidation in current model. We conducted three parallel experiments to examine the impacts of doubling SO2 emissions and incorporating heterogeneous oxidation of dissolved SO2 by nitrogen dioxide (NO2) on sulfate formation during winter haze. The results suggest that doubling SO2 emissions do not significantly affect sulfate concentrations, but adding heterogeneous oxidation of dissolved SO2 by NO2 substantially improve simulations of sulfate and other inorganic aerosols. Although the enhanced SO2 to sulfate conversion in the HetS (heterogeneous oxidation by NO2) case reduces SO2 concentrations, it is still largely overestimated by the model, indicating the overestimations of SO2 concentrations in the North China Plain (NCP) are mostly due to errors in SO2 emission inventory.

The concept design and detailed information of the SORPES station are introduced.
Main scientific findings based 5-year measurements at the station are summarized.
The future outlook of the development plan and its implications are discussed.
The results improved understanding of interaction of physical and chemical processes.
More SORPES-type stations are need to in different regions in China and the world.
This work presents an overall introduction to the Station for Observing Regional Processes of the Earth System – SORPES in Nanjing, East China, and gives an overview about main scientific findings in studies of air pollution-weather/climate interactions obtained since 2011. The main results summarized in this paper include overall characteristics of trace gases and aerosols, chemical transformation mechanisms for secondary pollutants like O3, HONO and secondary inorganic aerosols, and the air pollution – weather/climate interactions and feedbacks in mixed air pollution plumes from sources like fossil fuel combustion, biomass burning and dust storms. The future outlook of the development plan on instrumentation, networking and data-sharing for the SORPES station is also discussed.

A method for quantifying source impacts for secondary PM2.5 species is derived.
The method provides estimates of bias in modeled concentrations.
Adjusted concentrations match corresponding observations at monitored locations.
Sources impacts on secondary species are estimated over the US for 20 sources.
Community Multi-Scale Air Quality (CMAQ) estimates of sulfates, nitrates, ammonium, and organic carbon are highly influenced by uncertainties in modeled secondary formation processes, such as chemical mechanisms, volatilization, and condensation rates. These compounds constitute the majority of PM2.5 mass, and reducing bias in estimated concentrations has benefits for policy measures and epidemiological studies. In this work, a method for adjusting source impacts on secondary species is developed that provides estimates of source contributions and reduces bias in modeled concentrations compared to observations. The bias correction adjusts concentrations and source impacts based on the difference between modeled concentrations and observations while taking into account uncertainties at the location of interest; and it is applied both spatially and temporally. We apply the method over the US for 2006. The mean bias for initial CMAQ concentrations compared to observations is −0.28 (OC), 0.11 (NO3), 0.05 (NH4), and −0.08 (SO4). The normalized mean bias in modeled concentrations compared to observations was effectively zero for OC, NO3, NH4, and SO4 after applying the secondary bias correction. 10-fold cross-validation was conducted to determine the performance of the spatial application of the bias correction. Cross-validation performance was favorable; correlation coefficients were greater than 0.69 for all species when comparing observations and concentrations based on kriged correction factors. The methods presented here address model uncertainties by improving simulated concentrations and source impacts of secondary particulate matter through data assimilation. Secondary-adjusted concentrations and source impacts from 20 emissions sources are generated for 2006 over continental US.

Over 100 new particle formation events were studied.
In 50 events, charged and neutral particles were not formed at the same time.
In 42 of these events the charged particles formed before the neutral particles.
Their subsequent growth rates were not determined by the particle charge.
The result suggests that ion induced nucleation plays a role in particle formation.
Time series of nanoparticle number concentration during new particle formation (NPF) events in the urban environment of Brisbane, Australia, showed that the formation of charged particles often occurred before that of neutral particles. We monitored 241 days during the calendar year 2012 over which NPF events were observed on 108 days. We studied the times at which the charged and neutral particle concentrations in the size range 1.8–3.2 nm reached their peak values and found that they were clearly different in 50 events with the peak neutral particle concentration lagging behind the charged particle concentration during 42 of these events with a mean time lag of 24±12 min. While the charged particles were more likely to form before the neutral particles, once formed, the growth rate of the particles did not depend on their charge. While ion-induced nucleation is not the dominant mechanism of NPF in the atmosphere, our observations suggest that the presence of ions in the atmosphere plays a role that cannot be ignored.

Four types of S-rich particles are identified by SEM/FESEM-EDX
With on-line observation, characteristics of S-rich particles are discovered
Intensities of formation of S-rich particles are seasonally different
Direct individual analysis using Scanning Electron Microscopy combined with online observation was conducted to examine the S-rich particles in PM2.5 of two typical polluted haze episodes in summer and winter from 2014 to 2015 in Beijing. Four major types of S-rich particles, including secondary CaSO4 particles (mainly observed in summer), S-rich mineral particles (SRM), S-rich water droplets (SRW) and (C, O, S)-rich particles (COS) were identified. We found the different typical morphologies and element distributions of S-rich particles and considered that (C, O, S)-rich particles had two major mixing states in different seasons. On the basis of the S-rich particles’ relative abundances, S concentrations and their relationships with PM2.5 as well as the seasonal comparison, we revealed that the S-participated formation degrees of SRM and SRW would enhance with increasing PM2.5 concentration. Moreover, C-rich matter and sulfate had seasonally different but significant impacts on the formation of COS.

Air quality improvement in Los Angeles can inform air quality policies in developing cities.
Emission control efforts, their results, costs and health benefits are briefly summarized.
Today's developing cities face new challenges including regional pollution.
Air quality issues in Beijing are briefly compared and contrasted with Los Angeles.
Opportunities for co-benefits for climate and air quality improvement are identified.
Air quality improvement in Los Angeles, California is reviewed with an emphasis on aspects that may inform air quality policy formulation in developing cities. In the mid-twentieth century the air quality in Los Angeles was degraded to an extent comparable to the worst found in developing cities today; ozone exceeded 600 ppb and annual average particulate matter <10 mm reached ~150 mg·m−3. Today's air quality is much better due to very effective emission controls; e.g., modern automobiles emit about 1% of the hydrocarbons and carbon monoxide emitted by vehicles of 50 years ago. An overview is given of the emission control efforts in Los Angeles and their impact on ambient concentrations of primary and secondary pollutants; the costs and health benefits of these controls are briefly summarized. Today's developing cities have new challenges that are discussed: the effects of regional pollution transport are much greater in countries with very high population densities; often very large current populations must be supplied with goods and services even while economic development and air quality concerns are addressed; and many of currently developing cities are located in or close to the tropics where photochemical processing of pollution is expected to be more rapid than at higher latitudes. The air quality issues of Beijing are briefly compared and contrasted with those of Los Angeles, and the opportunities for co-benefits for climate and air quality improvement are pointed out.

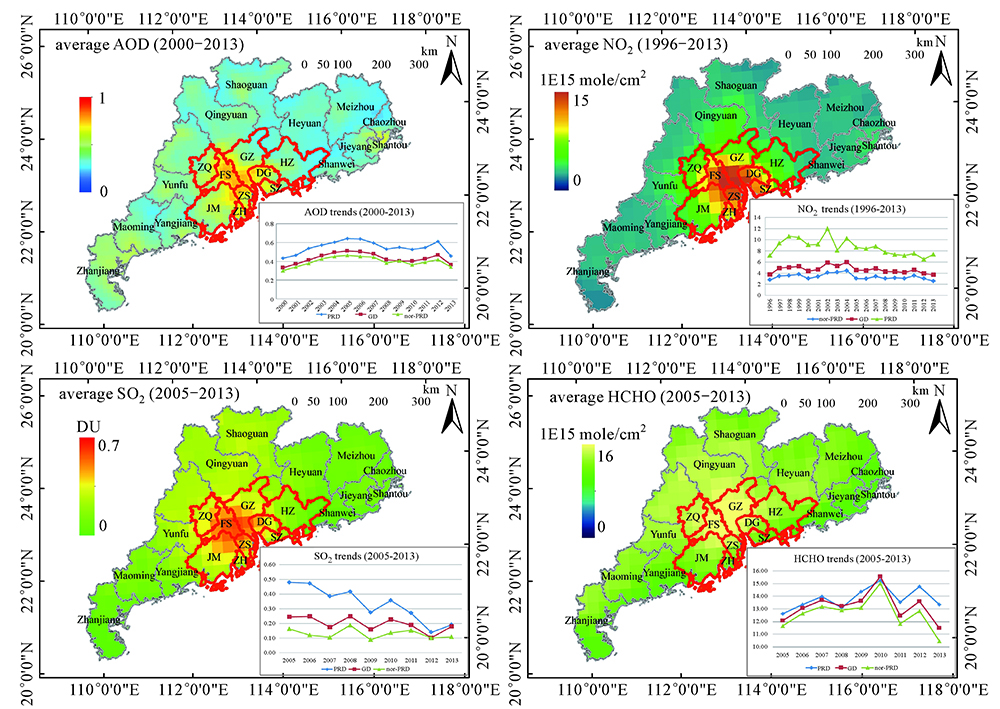
Spatial and temporal trends of the typical pollutants in PRD viewed from space.
Comparisons of the satellite retrievals with the collocated in situ data are given.
Among different MCs, the control measures applied in PRD are the most effective.
The unique HCHO trends imply significant contribution from the biogenic origins.
The Pearl River Delta (PRD) is one of the most industrialized, urbanized and populated regions in China, and thus has been long suffering from severe air pollutions. Space data provide a unique perspective for investigating the atmospheric environment at a regional scale. By utilizing multiple satellite retrievals from 2005 to 2013, this study presented, for the first time, the spatial patterns and temporal trends of typical air pollutants over PRD and its vicinity. As viewed from space, aerosol optical depth (AOD), NO2 and SO2 all had their higher values at the central part of PRD, and showed clear descending gradients as moving to the outskirt of this region. As to the inter-annual variation, all these pollutants had decreasing trends in PRD during the study period, which generally agreed with the relevant in situ measurements. However, the satellite retrievals differed from ground measurements when addressing NO2 and SO2 in the vicinity of PRD. This work also provides the inter-comparison among PRD and three other metropolitan clusters in China: PRD had relatively high AOD, moderate NO2 and low SO2 levels, and it was the only region achieving the effective reduction of NO2 and SO2 during last decade. Unlike the previous three pollutants, HCHO observed by satellite showed very special patterns: it had a relatively homogeneous spatial distribution over both of PRD and its vicinity, and presented an opposite increasing trend from 2005 to 2010. Moreover, PRD had the highest HCHO level among all the metropolitan clusters, hinting a considerable contribution of biogenic origins of HCHO in PRD.
The number of annual premature deaths attributable to China’s air pollution ranged from 350000 to 520000 from 2004 to 2013, while the figure in 2013 reached 9.9% of total deaths in China.
In 2004, the life expectancy potential years of life lost was 69.6 and 1.85 years respectively in contrast to 74.4 and 0.67 years respectively in 2013.
The number of PYLL attributable to air pollution in the northern regions is found to be larger than that of the southern regions.
The Environmental Burden of Disease (EBD) approach for outdoor air pollution has been used to calculate premature deaths and average potential years of life lost attributable to air pollution in China over the past 10 years with differences between the North and the South of the country being analyzed. The results indicate that: (1) Between 2004 and 2013, annual premature deaths attributable to outdoor air pollution in China ranged from 350000 to 520000. In 2013, deaths resulting from air pollution in China represented 9.9% of the country’s total deaths. (2) In 2004, the average life expectancy of the Chinese population and the number of potential years of life lost (PYLL) attributable to air pollution was 69.6 and 1.85 years respectively as compared to 74.4 and 0.67 years respectively in 2013. (3) The number of the PYLL attributable to air pollution in the northern regions of China is found to be larger than that of the southern regions. The PYLL figures of the northern and southern regions in 2004 were 2.3 and 1.8 years, respectively, with a difference of 0.5 years, as compared to 1.4 and 0.7 years respectively with a difference of 0.7 years in 2013.

Formation of new atmospheric aerosol particles is a global phenomenon that has been observed to take place in even heavily-polluted environments. In China, new particle production has been observed at very high pollution levels (condensation sink about 0.1s−1) in several megacities.
A holistic scientific understanding on the atmospheric phenomena associated with air quality as a whole, as well as on the connection between air quality and climate, is lacking at the moment.With a network of observation stations, we will be able to understand the interactions and feedbacks associated with the urban pollution mixture, and ultimately, are ready to make targeted strategies for the pollution control.
This paper summaries the recent advances in studying secondary new aerosol formation in China and shows how increased process-level understanding will help us to understand air quality-climate-weather interactions and how the feedbacks and interactions affect the air quality in highly-polluted environments such as those frequently encountered in Chinese megacities.
Formation of new atmospheric aerosol particles is a global phenomenon that has been observed to take place in even heavily-polluted environments. However, in all environments there appears to be a threshold value of the condensation sink (due to pre-existing aerosol particles) after which the formation rate of 3 nm particles is no longer detected. In China, new particle production has been observed at very high pollution levels (condensation sink about 0.1 s−1) in several megacities, including Beijing, Shanghai and Nanjing as well as in Pearl River Delta (PRD). Here we summarize the recent findings obtained from these studies and discuss the various implications these findings will have on future research and policy.

The new hybrid approaches for the source apportionment of PM2.5 were proposed.
The hybrid approach can be used for source apportionment of secondary species.
The metallurgy industry was the biggest contribution source to PM2.5 of Tangshan.
In winter, the contribution from the coal-fired boilers was the largest one.
The objective of this paper is to propose a hybrid approach for the source apportionment of primary and secondary species of PM2.5 in the city of Tangshan. The receptor-based PMF (Positive Matrix Factorization) is integrated with the emission inventory (EI) to form the first hybrid method for the source apportionment of the primary species. The hybrid CAMx-PSAT-CP (Comprehensive Air Quality Model with Extensions – Particulate Source Apportionment Technology – Chemical Profile) approach is then proposed and used for the source apportionment of the secondary species. The PM2.5 sources identified for Tangshan included the soil dust, the metallurgical industry, power plants, coal-fired boilers, vehicles, cement production, and other sources. It is indicated that the PM2.5 pollution is a regional issue. Among all the identified sources, the metallurgy industry was the biggest contribution source to PM2.5, followed by coal-fired boilers, vehicles and soil dust. The other-source category plays a crucial role for PM2.5, particularly for the formation of secondary species and aerosols, and these other sources include non-specified sources such as agricultural activities, biomass combustion, residential emissions, etc. The source apportionment results could help the local authorities make sound policies and regulations to better protect the citizens from the local and regional PM2.5 pollution. The study also highlights the strength of utilizing the proposed hybrid approaches in the identification of PM2.5 sources. The techniques used in this study show considerable promise for further application to other regions as well as to identify other source categories of PM2.5.

The mass concentrations of PM2.5 were studied at a plateau city.
Seasonal and spatial variation of chemical components in PM2.5 were analyzed.
Primary emissions were the main contributors of PM2.5.
A sampling campaign including summer, autumn and winter of 2014 and spring of 2015 was accomplished to obtain the characteristic of chemical components in PM2.5 at three sites of Kunming, a plateau city in South-west China. Nine kinds of water-soluble inorganic ions (WSI), organic and element carbon (OC and EC) in PM2.5 were analyzed by ion chromatography and thermal optical reflectance method, respectively. Results showed that the average concentrations of total WSI, OC and EC were 22.85±10.95 μg·m−3, 17.83±9.57 μg·m−3 and 5.11±4.29 μg·m−3, respectively. They totally accounted for 53.0% of PM2.5. Secondary organic and inorganic aerosols (SOA and SIA) were also assessed by the minimum ratio of OC/EC, nitrogen and sulfur oxidation ratios. The annual average concentrations of SOA and SIA totally accounted for 28.3% of the PM2.5 concentration. The low proportion suggested the primary emission was the main source of PM2.5 in Kunming. However, secondary pollution in the plateau city should also not be ignorable, due to the appropriate temperature and strong solar radiation, which can promote the atmospheric photochemical reactions.

New particle formation (NPF) event at multi rural sites in China
Identifying the characteristics of NPF event
Comparing NPF event between clean and polluted conditions
Quantifying contribution to the cloud condensation nuclei
Implication of climate and air quality
Long-term continuous measurements of particle number size distributions with mobility diameter sizes ranging from 3 to 800 nm were performed to study new particle formation (NPF) events at Shangdianzi (SDZ), Mt. Tai (TS), and Lin’an (LAN) stations representing the background atmospheric conditions in the North China Plain (NCP), Central East China (CEC), and Yangtze River Delta (YRD) regions, respectively. The mean formation rate of 3-nm particles was 6.3, 3.7, and 5.8 cm−3·s−1, and the mean particle growth rate was 3.6, 6.0, and 6.2 nm·h−1 at SDZ, TS, and LAN, respectively. The NPF event characteristics at the three sites indicate that there may be a stronger source of low volatile vapors and higher condensational sink of pre-existing particles in the YRD region. The formation rate of NPF events at these sites, as well as the condensation sink, is approximately 10 times higher than some results reported at rural/urban sites in western countries. However, the growth rates appear to be 1–2 times higher. Approximately 12%–17% of all NPF events with nucleated particles grow to a climate-relevant size (>50 nm). These kinds of NPF events were normally observed with higher growth rate than the other NPF cases. Generally, the cloud condensation nuclei (CCN) number concentration can be enhanced by approximately a factor of 2–6 on these event days. The mean value of the enhancement factor is lowest at LAN (2–3) and highest at SDZ (~4). NPF events have also been found to have greater impact on CCN production in China at the regional scale than in the other background sites worldwide.

We develop a multi-effect evaluation method to assess integrated impact of VOCs.
Enable policy-makers to identify important emission sources, regions, and key species.
Solvent usage and industrial process are the most important anthropogenic sources.
Styrene, toluene, ethylene, benzene, and m/p-xylene are key species to be cut.
Volatile organic compounds (VOCs) play important roles in the atmosphere via three main pathways: photochemical ozone formation, secondary organic aerosol production, and direct toxicity to humans. Few studies have integrated these effects to prioritize control measures for VOCs sources. In this study, we developed a multi-effects evaluation methodology based on updated emission inventories and source profiles, by combining the ozone formation potential (OFP), secondary organic aerosol potential (SOAP), and VOC toxicity data. We derived species-specific emission inventories for 152 sources. The OFPs, SOAPs, and toxicity of each source were estimated, the contribution and sharing of source to each of these adverse effects were calculated. Weightings were given to the three adverse effects by expert scoring, and then the integrated effect was determined. Taking 2012 as the base year, solvent use and industrial process were found to be the most important anthropogenic sources, accounting for 24.2% and 23.1% of the integrated effect, respectively, followed by biomass burning, transportation, and fossil fuel combustion, each had a similar contribution ranging from 16.7% to 18.6%. The top five industrial sources, including plastic products, rubber products, chemical fiber products, the chemical industry, and oil refining, accounted for nearly 70.0% of industrial emissions. Beijing, Chongqing, Shanghai, Jiangsu, and Guangdong were the five provinces contributing the largest integrated effects. For the VOC species from emissions showed the largest contributions were styrene, toluene, ethylene, benzene, and m/p-xylene.

Air pollution remediation using photocatalytic construction materials was tested.
NOx and VOC uptake rates on different materials were measured in the laboratory.
Effective NOx and VOC abatement levels were tested under real conditions.
Recommendations for implementation of photocatalytic materials are provided.
In the recent years, photocatalytic self-cleaning and “depolluting” materials have been suggested as a remediation technology mainly for NOx and aromatic VOCs in urban areas. A number of products incorporating the aforementioned technology have been made commercially available with the aim to improve urban air quality. These commercial products are based on the photocatalytic properties of a thin layer of TiO2 at the surface of the material (such as glass, pavement, etc.) or embedded in paints or concrete. The use of TiO2 photocatalysts as an emerging air pollution control technology has been reported in many locations worldwide. However, up to now, the effectiveness measured in situ and the expected positive impact on air quality of this relatively new technology has only been demonstrated in a limited manner. Assessing and demonstrating the effectiveness of these depolluting techniques in real scale applications aims to create a real added value, in terms of policy making (i.e., implementing air quality strategies) and economics (by providing a demonstration of the actual performance of a new technique).

We studied the heterogeneous reaction mechanism of gaseous HNO3 with solid NaCl.
HCl is released from heterogeneous reactions between gaseous HNO3 and solid NaCl.
Water molecules induce surface reconstruction of NaCl to facilitate the reaction.
Sea salt particles containing NaCl are among the most abundant particulate masses in coastal atmosphere. Reactions involving sea salt particles potentially generate Cl radicals, which are released into coastal atmosphere. Cl radicals play an important role in the nitrogen and O3 cycles, sulfur chemistry and particle formation in the troposphere of the polluted coastal regions. This paper aimed at the heterogeneous reaction between gaseous HNO3 and solid NaCl. The mechanism was investigated by density functional theory (DFT). The results imply that water molecules induce the surface reconstruction, which is essential for the heterogeneous reaction. The surface reconstruction on the defective (710) surface has a barrier of 10.24 kcal·mol−1 and is endothermic by 9.69 kcal·mol−1, whereas the reconstruction on the clean (100) surface has a barrier of 18.46 kcal·mol−1 and is endothermic by 12.96 kcal·mol−1. The surface reconstruction involved in water-adsorbed (710) surface is more energetically favorable. In comparison, water molecules adsorbed on NaCl (100) surface likely undergo water diffusion or desorption. Further, it reveals that the coordination number of the Cl−out is reduced after the surface reconstruction, which assists Cl−out to accept the proton from HNO3. HCl is released from heterogeneous reactions between gaseous HNO3 and solid NaCl and can react with OH free radicals to produce atomic Cl radicals. The results will offer further insights into the impact of gaseous HNO3 on the air quality of the coastal areas.
