
1 Introduction
1.1 Background
Power grid is defined by Power Grids European Technology Platform as a power network that can intelligently integrate the behaviors of all users (generators, consumers, and those who are both) related to it to effectively provide sustainable, economic, and safe power supply (Mutoh et al., 2006). Traditional power grids only focus on some basic functions, such as power generation, distribution, and control (Fang et al., 2012; Feng et al., 2019). Compared with current power grids, traditional power grids have the disadvantages of low reliability, easy outage, and poor power quality. The rapid development of new technologies, such as computing, communication, and sensing, provides the necessary conditions for power grids. However, the rapid development of power grid technology, such as the communication system, has brought new loopholes and increased the potential attack areas of power grids. Given the complexity and network dependence of power grids, the failure of any component in a network may cause an entire power grid to fail (Lee and Hu, 2019), which may lead to load rejection accidents and large-scale economic losses. According to the US Department of Energy, 58% of grid outages are caused by bad weather (Yuan et al., 2016). In the past decade, approximately 679 blackouts in the US alone were caused by weather, with each outage affecting at least 50000 customers (Wang et al., 2016). In July 2012, three major power grids in India were paralyzed one after another, and the blackout lasted for nearly two days before the power supply gradually returned to normal. The power supply in more than half of India was affected, affecting more than 600 million people. In March 2015, the cascading failure caused by a substation in the Netherlands led to a large area of power outage, which seriously impacted Northern Holland and other regions. In December 2015, three regional power stations in Ukraine were hijacked by computer viruses, causing circuit breakers to trip. Meanwhile, distribution companies were threatened with denial-of-service attacks to impede remote emergency operations, causing power outages that affected approximately 1.4 million people for several hours.
Consequently, researchers are committed to studying the ability of power grids to recover quickly and effectively from adversity to normal operation after the occurrence of extreme events, which is called resilience (Das et al., 2020). Power system resilience is one of the core requirements of power grids. The key to improving the resilience of power grids is determining the components that have a great impact on resilience. Determining such components to improve the resilience of power grids has become a new research direction.
1.2 Literature review
Although academic researchers believe that the resilience of power grids must be improved, no unified definition of resilience in power grids exists. The concept of resilience is involved in many disciplines. In economics, resilience is defined as the speed at which an entity or system continues its function and recovers from severe shocks to a stable state (Bruneckiene et al., 2018). In the social field, resilience is defined as the ability to predict risks, limit adverse consequences, and recover quickly in the face of turbulent changes through survival, adaptability, and growth (Cinner and Barnes, 2019). Adaptation and recovery are two key points in the definition of resilience. Adaptation refers to the ability to resist disasters, and recovery refers to the ability to recover to the best state after suffering disasters (Zhang et al., 2019; Dui et al., 2020). For power grids, resilience can also be defined from these two aspects.
The study of power grid resilience is divided into two different research approaches. The first approach involves the development of a qualitative framework for studying the resilience of power grids and identifying potential policies to improve resilience. The second approach focuses on the development of indicators for quantifying grid resilience, helping assess the network architecture and improving the response to adverse conditions. In this study, we focus on the second approach.
In the development of a resilience analysis framework for power grids, Huang et al. (2017a) introduced a comprehensive resilience response framework to improve the resilience of power grids and proved that topology switching can further improve the resilience of power grids. Sun et al. (2019) proposed a Monte-Carlo-simulation-based resilience evaluation framework for the distribution system and quantified resilience from the perspective of robustness and rapidity. Ge et al. (2019) studied the vulnerability model of the overhead system and proposed a resilience evaluation method based on load loss. To capture cascading failures in critical infrastructure, Krishnamurthy et al. (2020) proposed a general critical infrastructure resilience model for power grids under extreme events. Younesi et al. (2020) introduced a quantitative evaluation framework for power system resilience by considering the multi-micro-scale effect, which includes various features emphasized in the concept of power system resilience. Liu et al. (2020) introduced a resilience assessment framework to help design a highly resilient power transmission system against extreme weather events, such as typhoons. Zhong et al. (2020) defined network endurance as the cascade duration at criticality before complete network breakdown and developed an approach to endurance evaluation based on the load-dependent overload model. Panteli et al. (2017) evaluated different risk-based resilience enhancement measures for power transmission systems and introduced a probabilistic multi-period and multi-region resilience assessment method based on optimal power flow and sequential Monte Carlo simulation. Luo et al. (2018) proposed an evaluation method for distribution network resilience based on the influence of critical load under extreme weather events. Meng et al. (2018) comprehensively analyzed the connotation, attribute, and composition of community, resilience, and community resilience by summarizing the important issues and research progress in community resilience. Abdin et al. (2018) presented a comprehensive resilience modeling and optimization framework for power system planning under extreme weather conditions. Sabouhi et al. (2020) provided a basic framework with emphasis on high winding density for the quantification and modeling of power system resilience. On the basis of a proposed resilience metric, Cai et al. (2018) developed a corresponding evaluation methodology based on dynamic Bayesian networks. Fang et al. (2019) presented a p-robust optimization model for infrastructure network planning against spatially localized disruptions.
Several studies have been conducted on the quantitative index of power grid resilience. Huang et al. (2017b) studied the current research on system resilience enhancement within and beyond power grids, elaborated on resilience definition and quantification, and discussed several challenges and opportunities for system resilience enhancement. Hosseini and Parvania (2020) developed a set of probabilistic indicators to assess the benefits of distribution automation on resilience and presented a model for assessing the temporal and spatial impacts of hurricanes under different automation scenarios. Hussain et al. (2019) introduced an index for evaluating the resilience of microgrids to local critical load in case of sudden power interruption. Mylrea and Gourisetti (2017) studied the potential impact of blockchain technology on the security and network resilience of power grids. Barker et al. (2013) proposed two resilience importance measures, which quantify the adverse and beneficial effects on system resilience under the conditions of component interruption and non-interruption. Fang et al. (2016) improved the quantification of resilience and proposed two importance measures of resilience focusing on restoration. Pan et al. (2019) studied the importance of systems from the perspective of resilience, analyzed the importance measure based on resilience, and provided suggestions for the design and optimization of the architecture. Espinoza et al. (2020) proposed a new centrality evaluation to prove that the modification of selective elements in some networks can significantly improve the resilience of the entire system to seismic events. Li et al. (2019) presented an evaluation method for importance measure to improve the wind resistance of power systems. Li et al. (2018) introduced an improved PowerOutage Rank algorithm to rank the importance of the identified key grid nodes and proposed a restoration strategy of resilient grid based on the improved algorithm.
1.3 Motivation
According to the above review, many scholars focus on the resilience of power grids from the perspective of power grid design and operation before disasters, rather than during or after restoration. However, the restoration of failed components plays a key role in the resilience of power grids after disasters. How do we repair the power grid immediately after an attack? What is the impact of repairing different electrical stations or transmission lines on power grid resilience? How to determine the best recovery sequence for failed components? Restoring the power grid operation as soon as possible is a clear approach to determining the recovery sequence of components. In this paper, the recovery priority of failed components in the post disaster stage is studied under the background of power grid resilience research. The recovery sequences of failed components under different resilience importance measures are comprehensively considered to determine the best recovery sequence. This method can be used for decision-making during the restoration stage of power grids, thereby reducing economic losses and guiding the recovery process of power grids after a disaster.
The rest of this paper is organized as follows. Section 2 describes the concept, characteristics, and recovery process of power grid resilience. The resilience optimization model is introduced in Section 3. Section 4 presents three kinds of importance measures for determining the best period to recover the failed components. Section 5 takes Shandong Power Grid as an example to analyze the residual resilience under different conditions. The conclusions and future work are provided in Section 6.
2 Definition and quantification of power grid resilience
Given that Shandong Province has a large population and is an important energy base in China, the development of its power grid has received special attention. According to the State Grid Shandong Electric Power Company’s annual report on the information disclosure of power supply enterprises in 2019, the total social electricity load of Shandong Province reached a record high of 621.872 billion kWh. In the first quarter of 2020, the power consumption of Shandong Province ranked first in China, and its power consumption in the first half of 2020 is among the top three. The Shandong Power Grid plays an important role in the industrial and economic development of Shandong Province. Thus, studying its power grid resilience has great significance. The power grid in Shandong Province involves 16 cities: Heze, Jining, Rizhao, Linyi, Tai’an, Dezhou, Qingdao, Yantai, Weifang, Zibo, Liaocheng, Jinan, Binzhou, Dongying, Zaozhuang, and Weihai. Power stations are set up in Heze, Jining, Rizhao, Dezhou, Yantai, Weihai, Zibo, and Binzhou, and power distribution stations are set up in the other eight cities, which are connected by transmission lines involving 25 branches. This paper takes the 16-bus power grid in Shandong Province as a case study.
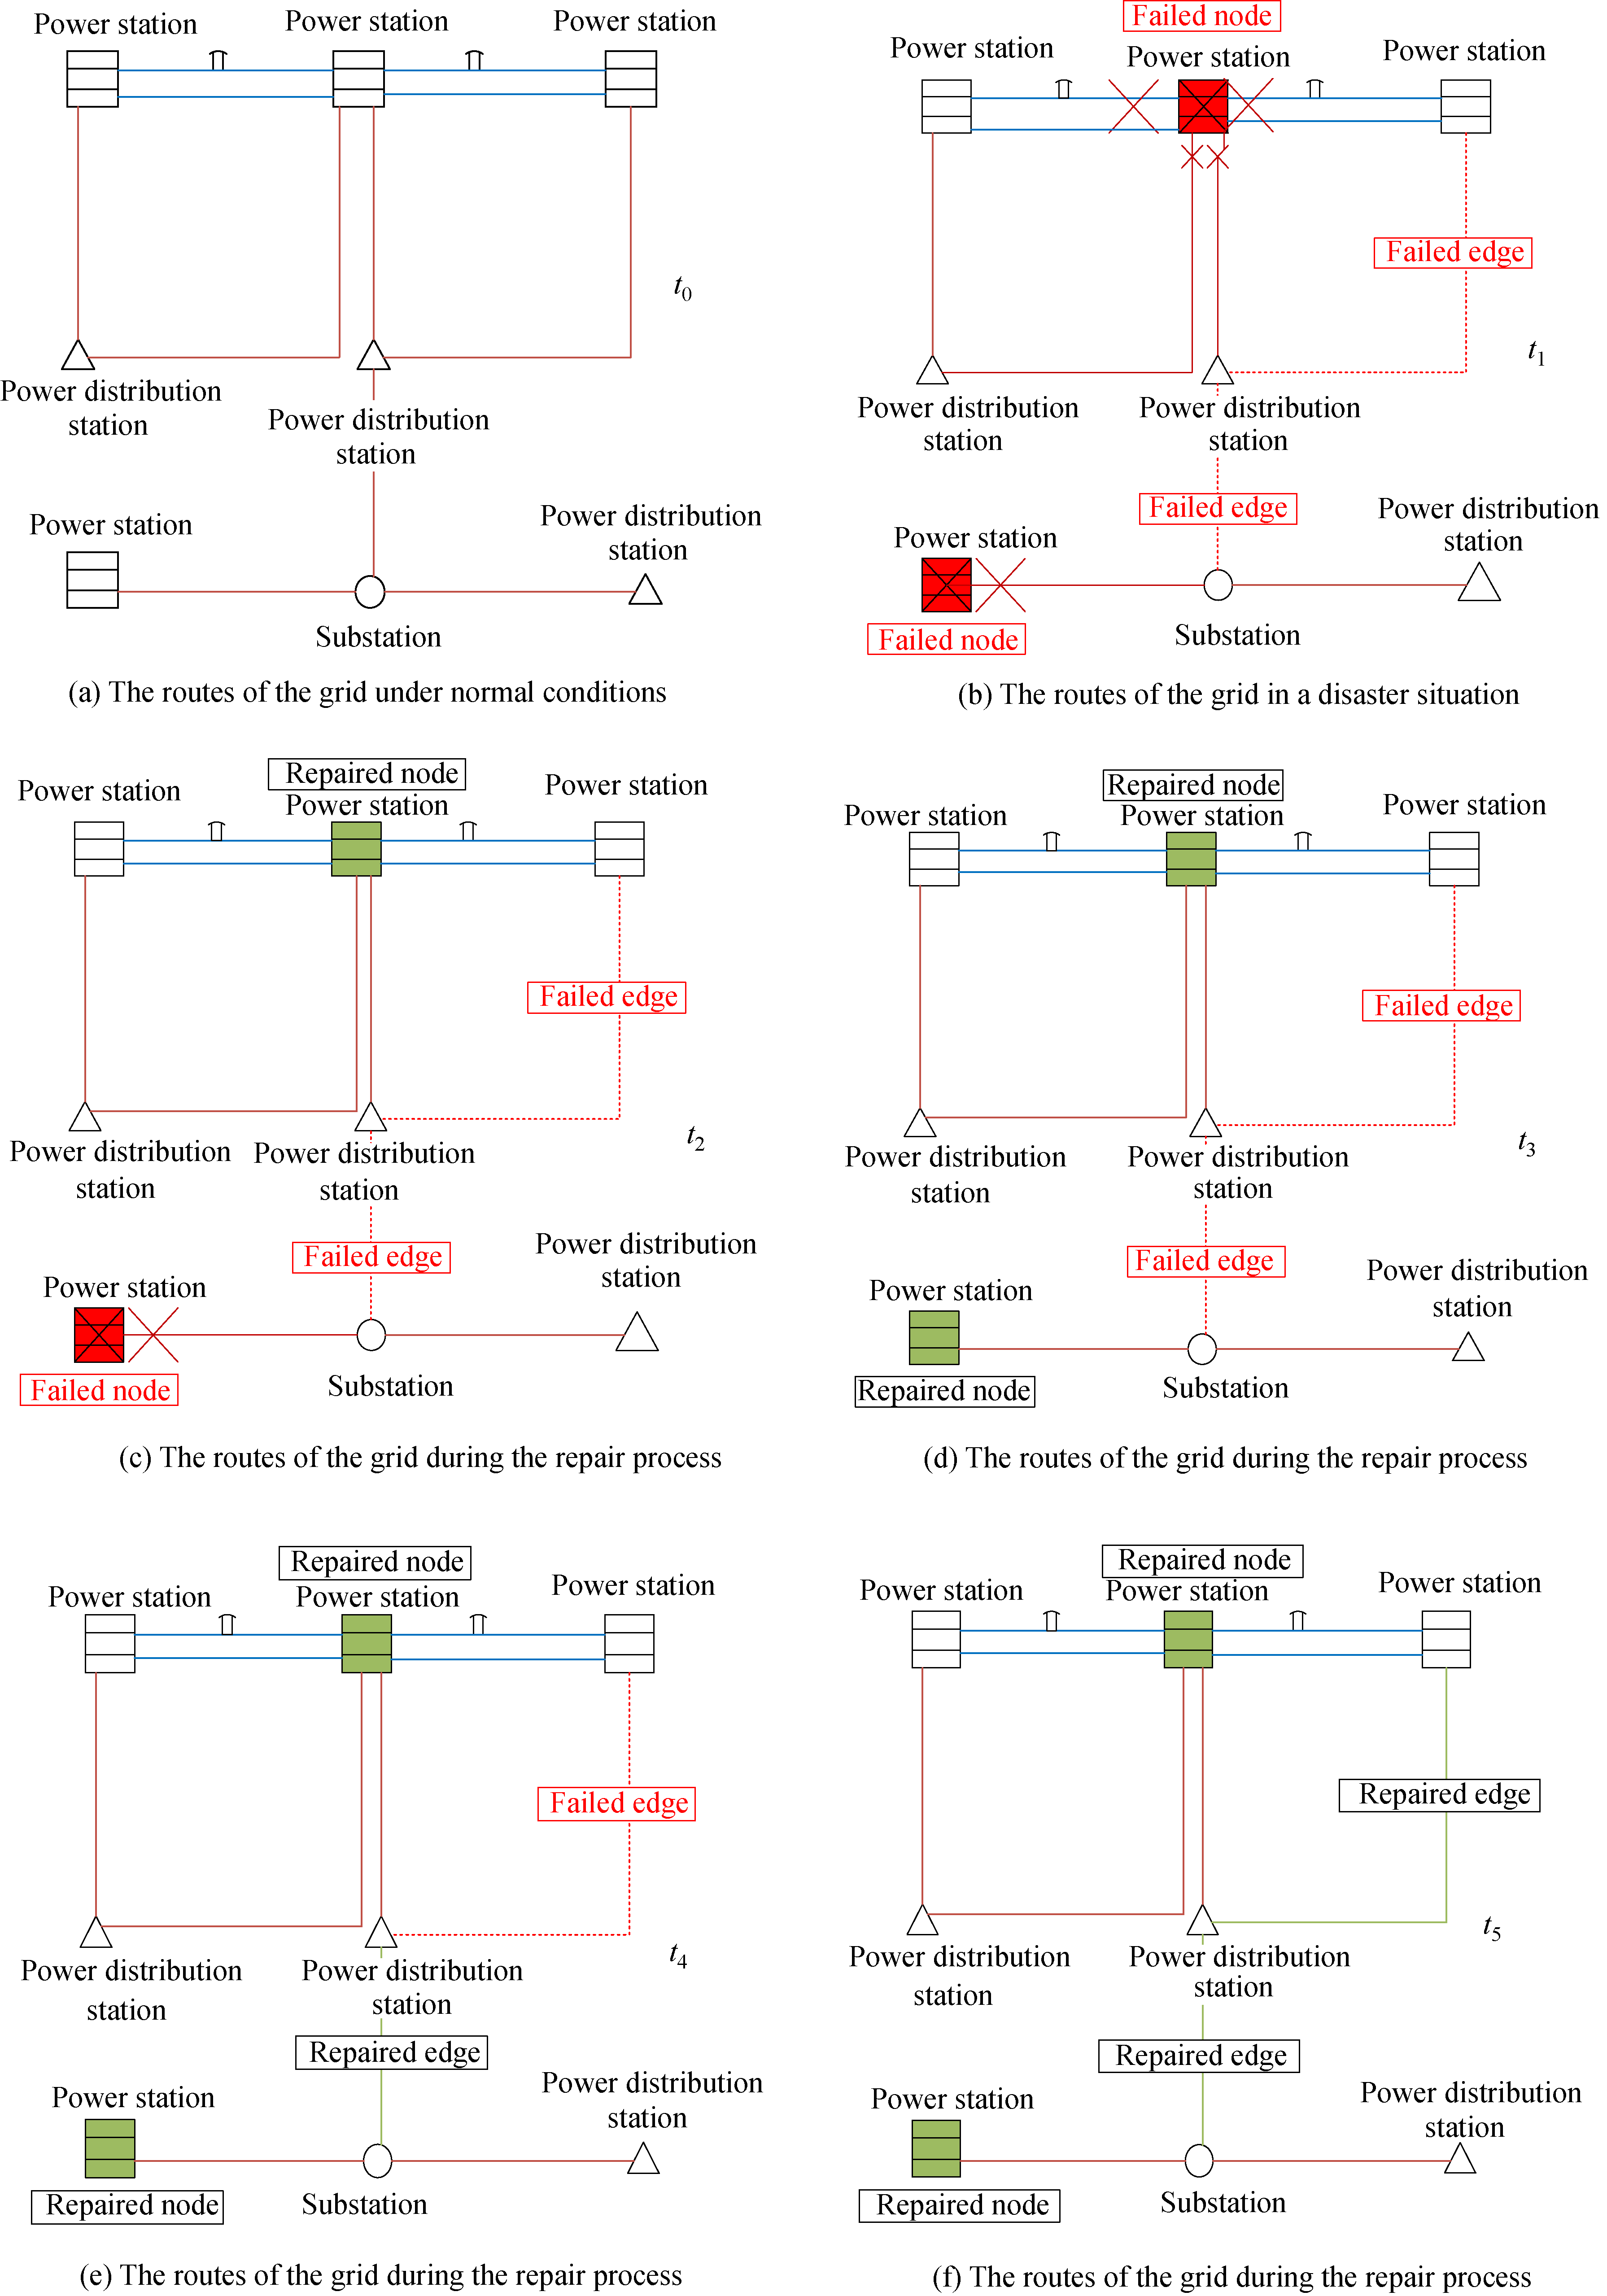
Taking the Shandong Power Grid as the background, the following resilience optimization model is established. According to the definition of resilience in different disciplines and combined with the power grid characteristics, resilience is defined. The resilience process of power grids is divided into six states, as shown in Fig. 1.

Definition 1. In this paper, power grid resilience is defined as the ability of a power grid to resist, adapt, and quickly recover to normal and stable operation state after being disrupted by disasters or other destructive events.
At time , the power and distribution stations are operating at normal state. After affected by a disaster at time , two power stations and two transmission lines fail at the same time, and the transmission lines connected to the power station are also in failure state. The first power station is successfully repaired at , and the transmission lines connected to it also return to normal condition. The second power station is successfully repaired at , and the left two failed transmission lines are consecutively repaired at and . The power grid system completely returns to normal, and the system performance recovers at .
The electric power generation rate is often used to measure the system performance of power grids, and the unit is expressed in kWh. In this paper, is used to describe the electric power generation rate of the power grid at time . represents the electric power generation rate under the optimal operation state of the power grid. According to the definition of power grid resilience, this paper focuses on how much grid resilience is unsatisfied at a certain time, that is, the concept of residual resilience.
Definition 2. In this paper, residual resilience is quantified as the difference between the current resilience and the optimal resilience at time , which is defined as follows:
where is expressed by the integral of the difference between the optimal and the worst electric power generation rates in the period of , and is expressed by the integral of the difference between the current and the worst electric power generation rates in the same period.
is in the range of . when , indicating that the grid system has not start to recovered from the post disaster state. when , which corresponds to the ideal situation that the system recovers to the target state after the disaster. The nearer is to 0, the better the recovery situation is. This definition can quantify the scale and speed of system recovery action.
3 Resilience model for power grid
A disaster event may lead to the failure of one or more components in the power grid. When multiple components fail, the key point of the recovery strategy is to determine the recovery sequence of components to maximize the recovery ability of the power grid and recover as near as possible to the best state in a certain period. This paper focuses on the influence of restoring a single component on the residual resilience of the power grid. Therefore, the best recovery sequence of failed components is found to achieve the minimum residual resilience within the recovery time range.
Before the construction of the model, the following assumptions are made. The states of the electrical stations and transmission lines are assumed to be independent of each other, and only two states exist, namely, normal operation and fault. After a disaster, the failed electrical stations and transmission lines can be repaired, and the repair time is the same. This paper assumes that the recovery of failed components is a discrete event. In other words, only one electrical station or transmission line can be repaired in a given period, and the capacity of the electrical stations and transmission lines is known.
The power grid is defined by , which is composed of a set of electrical stations and a set of transmission lines . The set of electrical stations is divided into a set of power station and a set of power distribution stations . The power grid contains three components in this study: , , and . represents the capacity of the grid components. The capacities of power station , distribution station , and transmission line () are denoted as , , and , respectively. is defined as the set of grid components, and is modeled as set of failed power grid components. When all components fail, the system performance approaches (minimum value of the electric power generation rate).
This paper aims to determine the recovery sequence of the failed component set with the minimum residual resilience as the objective in a period. Therefore, time set is composed of multiple discrete time periods, and only one failed component can be repaired in each period.
is modeled as the electric power flow of power distribution station at time . This paper aims to maximize the sum of as in Eq. (2).
The residual resilience equation (Eq. (3)) is obtained by introducing Eq. (2) into Eq. (1).
The system repair begins when , so can be represented by . Therefore, in the recovery time span , the minimum residual resilience is described as follows.
represents the electric power flow transmitted between power stations and at . and are states of electrical station and transmission line , respectively, which are 1 for operating status, and 0 for fault status.
Equation (5) ensures that the electric power generation rate of electrical station () does not exceed its supply capacity. Equations (6)–(8) indicate that transmission line and power distribution station shall not exceed their capacities, respectively. Equations (11)–(12) show that the situations of transmission line and electrical station will improve with the passage of time, indicating that once the failed component is repaired, it will not fail again. Equation (13) shows that only one failed transmission line or electrical station can be repaired in a period. Equations (14)–(17) ensure two states (i.e., normal operation or fault) in transmission line and electrical station .
4 Resilience analysis of power grid based on importance measures
Generally, the importance measure is used to quantify the contribution of each component in the system to the overall system performance, such as reliability, risk, and availability (Si et al., 2019; 2020; Dui et al., 2018; 2019). In this paper, the importance measure is extended to the residual resilience for the power grid. Different importance measures are developed around the resilience for the power grid. The transmission line and electrical station fault will directly or indirectly affect the operation state of the power grid. Therefore, the recovery sequence of failed components within a certain time range must be determined to ensure that the system status returns to normal. In addition, the steps of power grid residual resilience analysis based on the importance measures are presented to provide operational ideas for the subsequent case study analysis.
The component recovery period (CRP) of a failed component (), denoted as , is defined as follows:
where and represent the optimal time periods to repair a failed transmission line and a failed electrical station, respectively. represents the total repair time. The CRP indicates the recovery priority of failed components and quantifies the residual resilience of the power grid once the failed components are restored. The smaller the value is, the more important the component is to the residual resilience of the power grid.
However, the CRP cannot quantify the impact of a single component on the residual resilience of the power grid. Thus, the risk reduction worth (RRW) and risk achievement worth (RAW) (Levitin et al., 2003) are extended into the power grid system as follows.
The RRW of a failed component (), denoted as , is defined as follows:
where is the optimal residual resilience of the power system at time , and represents the optimal residual resilience of the power system when failed component could be recovered within time range . The RRW is used to measure the potential impact on the residual resilience of the power grid when a failed component cannot be recovered. The smaller the is, the greater the impact of the recovery of the failed transmission line or electrical station is on the residual resilience of the power grid.
The RAW of a failed component (), denoted as , is defined as follows:
where represents the residual resilience of the initial state when the system fails, and represents the optimal residual resilience of the power grid where only failed component is recovered. The smaller the is, the greater the impact of the component is on the power system.
This paper uses the Copeland method to sort the importance measures of the power system components. The Copeland method was first proposed by Copeland (1951). The idea of “the minority obeys the majority” was adopted to select the object with the highest Copeland score. The Copeland score is represented by the difference between the number of times the object has defeated other objects and the number of times the object has been defeated by other objects.
Let a set of component importance measures be , then the Copeland score of component after comparing the kth importance measure index for components and , , is defined as follows:
where and are the kth importance measure indices of components and , respectively. When is better than , the Copeland score of component is increased by one, and vice versa. When the indices are equal, the score does not change.
According to Al-Sharrah (2010), the total Copeland score for component , , is the sum of all the scores associated with component :
The higher the Copeland score is, the more important the component is to other components. The Copeland method is a very effective nonparametric ranking method, which does not need any information on the preference of decision makers. This method cannot guarantee that all components have different grades. When the Copeland scores of two components are equal, they have the same level, which is acceptable in theory and practice.
Finally, the steps of the residual resilience analysis based on importance measures are presented as follows.
Step 1: For a given power grid, the components in the power grid are divided into two sets: A set of electrical stations and a set of transmission lines .
Step 2: According to Eqs. (18)–(20), three importance measures of different components are calculated, and the priority of components with different importance measures is obtained by sorting them under each importance measure.
Step 3: The Copeland scores of each component is calculated based on three ranking results of importance measures, and the TOTAL sequence is obtained.
Step 4: Based on the residual resilience model in Section 3, the system is repaired according to four priority sequences, and the residual resilience value of the system in each period is obtained.
5 Case study
In this paper, the Shandong Power Grid is taken as the case study. Considering two cases, namely, partial components failure and failure of all components, the recovery priority of the failed components under different importance measures is calculated. Residual resilience analysis is performed on the power grid according to different recovery sequences to prove the feasibility of the model.
To facilitate the study, according to the characteristics of the model in this paper, the power stations and power distribution stations of the Shandong Power Grid are respectively represented by letters S and D and are numbered. The simplified diagram is shown in Fig. 2. The set of electrical stations is denoted as {S1, S2, S3, D4, D5, S6, D7, S8, D9, S10, D11, D12, S13, D14, D15, S16}, and the set of transmission lines is denoted as {S1, S2 S1, D5 S2, S3 S2, D4 S2, D5 S2, D15 S3, D4 S3, D15 D5, D4 S6, D5 S6, D11 S6, D12 S6, S13 D7, D4 D7, D9 S8, D7 D9, D4 D9, S10 D9, D14 S10, D11 D12, S13 S13, D14 D15, D4 S16, S8 S16, D7}.

In Fig. 2, each number represents a corresponding electrical station. In this simplified diagram, the assumption is that the two power stations do not perform voltage transformation operations on the transmission line.
The case data comes from the 2019 Power Yearbook of each city in Shandong Province, which is the latest according to the official website of the Statistics Bureaus of these cities. According to the city classification in Section 2, the annual industrial power generation and consumption are taken as supplementary data for support. The electrical stations and transmission lines of the Shandong Power Grid and the case data are shown in Table 1.
Tab.1 Symbols and data for components in Shandong Power Grid |
| Cities | Electrical stations | Capacities (kWh) | Transmission lines |
|---|---|---|---|
| Heze | S1 | 208.99 | S1, S2 S1, D5 |
| Jining | S2 | 354.10 | S2, S3 S2, D4 S2, D5 S2, D15 |
| Rizhao | S3 | 213.00 | S3, D4 S3, D15 |
| Linyi | D4 | 484.40 | — |
| Tai’an | D5 | 198.38 | D5, D4 |
| Dezhou | S6 | 177.70 | S6, D5 S6, D11 S6, D12 S6, S13 |
| Qingdao | D7 | 431.82 | D7, D4 D7, D9 |
| Yantai | S8 | 506.20 | S8, D7 |
| Weifang | D9 | 536.24 | D9, D4 D9, S10 D9, D14 |
| Zibo | S10 | 294.01 | S10, D11 |
| Liaocheng | D11 | 301.71 | — |
| Jinan | D12 | 284.36 | D12, S13 |
| Binzhou | S13 | 1210.90 | S13, D14 |
| Dongying | D14 | 294.53 | — |
| Zaozhuang | D15 | 153.87 | D15, D4 |
| Weihai | S16 | 158.87 | S16, S8 S16, D7 |
5.1 Case 1 for partial components failure
When some components of the power grid fail at the same time, the recovery priority of the failed components is analyzed, and the residual resilience is discussed in Case 1. The set of failed components is {S1, S2, D4, D7, S8, D11, S16, (S2, S3), (S3, D4), (S3, D15), (D7, D9), (D9, S10), (D9, D14), (S13, D14)}.
Combined with several importance measure models, the , , and of the failed components are shown in Fig. 3. In Fig. 3, the transmission line (S13, D14) connecting Binzhou and Dongying has the highest priority under the three importance measures. The importance of the transmission line (D9, D14) connecting Weifang and Dongying is the lowest under the measure of CRP. On the basis of RRW, transmission lines (D9, D14), (D9, S10), (D7, D9), (S3, D4), and (S2, S3) and Linyi electrical station D4 are equally unimportant.

According to the Copeland method, the Copeland score of the failed components with three importance measures is obtained as shown in Fig. 4.

In Fig. 4, the Copeland score of the transmission line (S13, D14) connecting Binzhou and Dongying is the highest, while that of the transmission line (D9, D14) connecting Weifang and Dongying is the lowest. These results are basically consistent with those of the CRP, indicating that under assumed conditions, the transmission line between Binzhou and Dongying should be guaranteed to work normally first, the Linyi electrical station should be repaired next, and the transmission line connecting Weifang and Dongying should be repaired at last.
The comprehensive importance measure obtained according to the Copeland scores in descending sequence is defined as , and residual resilience with time under several importance measures is shown in Fig. 5.

Figure 5 shows that the residual resilience of the first period decreases significantly under CRP and RAW. This phenomenon occurs because the transmission line (S13, D14) connecting Binzhou and Dongying is repaired and the power demand of Dongying electrical station D14 is fully satisfied. The RRW shows its advantage in period 4 as the repair of the transmission line (S3, D15) connecting Rizhao and Zaozhuang meets the power demand of Zaozhuang electrical station D15. In the fifth period of the CRP, Yantai electrical station S8 is repaired, followed by the transmission line (S3, D15) connecting Rizhao and Zaozhuang.
The comparison of the four curves indicates that the reduction of under the CRP is the most obvious, which is as low as 0.164, followed by the comprehensive importance measure, which is 0.172, and then the RRW (0.175) and the RAW (0.182), respectively. The results show the RAW sequence is inappropriate for restoration, while the other three recovery sequences are relatively desirable. The RRW sequence has obvious advantages in the former stage, while the CRP sequence is superior in the later stage. When only the result is considered and not the process, the CRP sequence is optimal.
5.2 Case 2 for failure of all components
Case 2 is used to calculate the recovery priority of failed components when all the components of the power grid fail simultaneously and analyze the residual resilience of the power grid. When all the components in the grid are unavailable, repairing only one component has no effect on the system, so the RAW is not discussed here.
Combined with several importance measure models, the and of the failed components are shown in Fig. 6. In Fig. 6, Binzhou electrical station S13, Dongying electrical station D14, and the transmission line (S13, D14) have high priorities under the two importance measures. The importance of the transmission line (D12, S13) connecting Jinan and Binzhou is the lowest under the CRP. Under the RRW, the transmission line (D9, D4) connecting Weifang and Linyi is relatively unimportant.

According to the Copeland method, the Copeland score of the failed components with the two importance measures is obtained as shown in Fig. 7.

In Fig. 7, the Copeland score of the transmission line connecting Weihai and Qingdao (S16, D7) is the highest, while the transmission lines connecting Rizhao and Zaozhuang (S3, D15) and connecting Qingdao and Weifang (D7, D9) have the same Copeland score, which are the lowest.
The residual resilience with time under several importance measures is shown in Fig. 8.

Figure 8 shows that remains at 1 under the CRP and the RRW in the first three periods because at least three components (two electrical stations and one transmission line) must be restored before the system can operate. Under the comprehensive importance measure, the residual resilience does not begin to decrease until the 13th period because the transmission line is repaired in the early stage, and the repair of Rizhao electrical station S3 in the 13th period meets the demand of Linyi electrical station D4. The CRP and the RRW start to be different in the 9th period because the repair components of the two are basically the same in the first eight periods, while the repair of Jining electrical station S2 in the 9th period of the CRP meets the requirements of Linyi electrical station D4.
The comparison of the three curves indicates that the reduction of under the CRP is the most obvious, which is as low as 0.190, followed by the RRW, which is 0.256; while decreases the least under the comprehensive importance measure, which is as low as 0.573. In this case, the CRP sequence is undoubtedly the best choice. However, the recovery sequence based on the Copeland scores is still imperfect. In this recovery sequence, successive transmission lines are repaired first, and then successive nodes are repaired. The grid system does not start to operate until the 13th period, which is not beneficial in a process-focused situation.
6 Conclusions and future work
Considering the severity of power grid disasters, a residual resilience model based on importance measure is proposed. According to the different effects of failed components on the resilience of the power grid, the priority of the components for repair after the damage is determined. Within limited repair time, this model can help employees determine the optimal recovery sequence of the failed power grid components. This paper analyzes the residual resilience of two cases to provide suggestions and references for the repair of power grid components in the post-disaster stage.
This paper does not specifically consider different types of disasters, which can be studied in future research. In future work, specific quantitative methods will be provided according to the size of the affected area under different types of disasters. According to the disaster situation, resources are further allocated to increase the contributions to reducing the impact of the disaster. The recovery time of the failed nodes and the failure process of the power grid will be studied further.