| ENGINEERING MANAGEMENT THEORIES AND METHODOLOGIES |
|
|
|
|
|
| An Evaluation Model for the Coordinated Development of a Circular Economy in China and Its Application to Energy-intensive Industries |
Ji-liang Zheng1,*( ),Chen Zheng2,Pan Chen1,Ching Yuan Luk1 ),Chen Zheng2,Pan Chen1,Ching Yuan Luk1 |
1. Faculty of Management & Economics, Kunming University of Science & Technology, Kunming 650093, China
2. Zhongshan Securities Company, Beijing 100044, China |
|
|
|
|
|
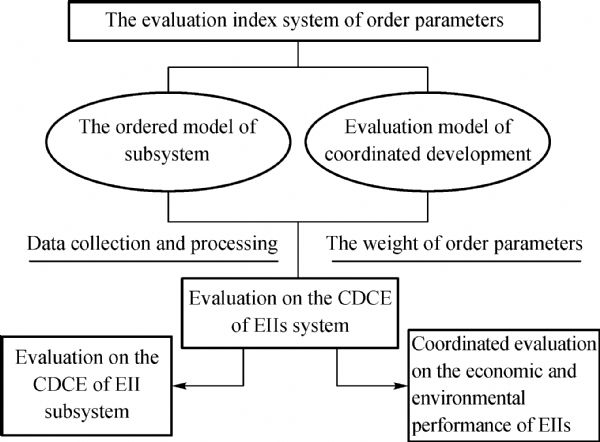
| Abstract: Energy-intensive industries (EIIs) are fundamental to the industrial development of China and are also the key industries of a circular economic infrastructure. It is worth paying attention to the coordinated development of a circular economy using EIIs due to the present interrelationship among EIIs. It is related to the optimization and comprehensive performance improvement of a circular economy. Based on the perspective of order parameter, this study uses economic and environmental subsystems to establish an evaluation model that examines the coordinated development of a circular economy within six main EIIs and an EII cluster from 2006 to 2011 in China. The result shows that the level of coordinated development in a circular economy among six EIIs differs and the level of coordinated development of circular economy among the EII cluster lags behind that of each EII examined. It also shows that the outside coordinated degree of EIIs is lower than the inside coordinated degree of each EII. |
| Keywords
order parameter
coordinated degree evaluation
energy-intensive industry
circular economy
|
|
在线预览日期:
发布日期: 2015-05-07
|
|
|
| 1 |
Anbanandam, R., Banwet, D.K., & Shankar, R. 2011. Evaluation of supply chain collaboration: a case of apparel retail industry in India. International Journal of Productivity and Performance Management, 60(2), 82–98
https://doi.org/10.1108/17410401111101449
|
| 2 |
Bao, J., & Zhu, S. 2007. Study on the circular economy development mode for iron and steel industry in China. Science Technology and Industry, 7(10), 1–4, 12
|
| 3 |
Cai, S., Wang, J., Xu, H., & Yao, M. 2007. The organization and conjunction mechanism that the district business enterprises evolve from enterprises group to industry cluster. Inquiry into Economic Issues, (3), 69–73
|
| 4 |
Chen, Y., & Zhao, L. 2010. On the coordination degree of the energy-environment-economy compound system of Shandong. Journal of Shandong Administration Institute and Shandong Economic Management Personnel Institute, (4), 53–56
|
| 5 |
Christopher, M. 2000. The agile supply chain: competing in volatile markets. Industrial Marketing Management, 29(1), 37–44
https://doi.org/10.1016/S0019-8501(99)00110-8
|
| 6 |
Guo, L., Su, J., & Xu, D. 2005. Study on the evolvement mechanism of industrial ecosystem based on Haken model. China Soft Science, (11), 156–160
|
| 7 |
Jeffrey, H. D. 2000. Collaborative Advantage: Winning through Extended Enterprise Supplier Networks. New York: Oxford University Press
|
| 8 |
Klodt, H. 2000. The evolution mechanism of logistics synergetic system. Birmingham: University of Birmingham
|
| 9 |
Li, Y., & Guo, P. 2012. Comparative analysis on the coordinated degree of regional IUR cooperative innovation system. Journal of Commercial Era, (25), 133–135
|
| 10 |
Sun, B., & Zheng, C. 2009. The order parameter of the industrial cluster innovation system. Statistics and Decision, (6), 140–142
|
| 11 |
Sun, J., Xi, Y., Wang, J., & Fu, Y. 2007. System simulation method for circular economy pattern–case study from coal industry. Engineering Sciences, 9(5), 62–71
|
| 12 |
Tang, Y., & Li, J. 2012. Research on the economic synergistic degree between renewable resources industry and equipment manufacturing industry in industrial city. Economic Geography, 32(4), 90–96
|
| 13 |
Türkay, M., Oru?, C., Fujita, K., & Asakura, T. 2004. Multi-company collaborative supply chain management with economical and environmental considerations. Computers & Chemical Engineering, 28(6/7), 985–992
https://doi.org/10.1016/j.compchemeng.2003.09.005
|
| 14 |
Van Beers, D., Bossilkov, A., Corder, G., & Van Berkel, R. 2007. Industrial symbiosis in the Australian minerals industry: the cases of kwinana and gladstone. Journal of Industrial Ecology, 11(1), 55–72
|
| 15 |
Van Beers, D., Corder, G. D., Bossilkov, A., & Van Berkel, R. 2007. Regional synergies in the Australian minerals industry: case-studies and enabling tools. Minerals Engineering, 20(9), 830–841
|
| 16 |
Van Berkel, R. 2006. Regional resource synergies for sustainable development in heavy industrial areas: an overview of opportunities and experiences. Perth, Australia: Curtin University of Technology
|
| 17 |
Xu, H., Xu, J., & Kang, S. 2003. Collaborative model and empirical analysis on organization system of China state-owned pharmaceutical manufacturing industry. China Technology Forum, (1), 113–117
|
| 18 |
Zhang, J. B. 2012. The path selection of sustainable development of resource based industry cluster. Science and Technology Progress and Policy, 29(19), 51–54
|
| 19 |
Zhang, J. L. 2012. Industry chain model of ecological and low-carbon economy in non-ferrous metal industry. China Nonferrous Metallurgy, 41(2), 79–83
|
| 20 |
Zhang, J. 2012. Research on collaborative development of Guangzhou automobile industry cluster and regional logistics (Master’s degree thesis). Guangzhou: South China University of Technology
|
| 21 |
Zhao, Y. 2011. Research on collaborative development of manufacturing industry and the third party logistics (Master’s degree thesis). Changsha: Central South University
|
| 22 |
Zheng, J., & Chen, W. 2009. On the development of energy-intensive industrial cluster based on circular economy. Science and Technology Management Research, 29(9), 271–273
|
| 23 |
Zheng, J., & Chen, W. 2010. Discuss on the circular economy coordination development of energy intensive industries. Science and Technology Progress and Policy, 27(1), 53–56
|
| 24 |
Zheng, J., Chen, W., & Chen, Z. 2008. Analysis on the circular economy development strategy of energy-intensive industry in Yunnan Province. Science and Technology Management Research, 28(8), 92–94
|
| 25 |
Zheng, J., & Li, J. 2013. The circular economy coordination development mode of energy intensive industries based on building material. 2013 China Engineering Management Forum Proceedings, 35–38
|
| 26 |
Zhong, M., Wu, Y., & Luan, W. 2011. Model of synergy degree between port logistics and urban economy. Journal of Dalian Maritime University, 37(1), 80–82
|
|
Viewed |
|
|
|
Full text
|
|
|
|
|
Abstract
|
|
|
|
|
Cited |
|
|
|
|
| |
Shared |
|
|
|
|
| |
Discussed |
|
|
|
|