|
|
|
|
| Efficiency measurement for mixed two-stage nonhomogeneous network processes with shared extra intermediate resources |
Qingxian AN, Xuyang LIU, Shijie DING( ) ) |
| School of Business, Central South University, Changsha 410083, China |
|
|
|
|
|
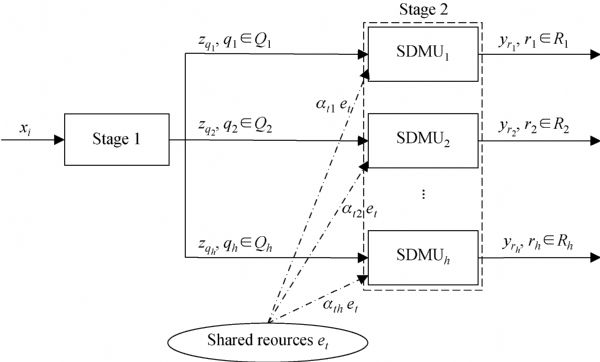
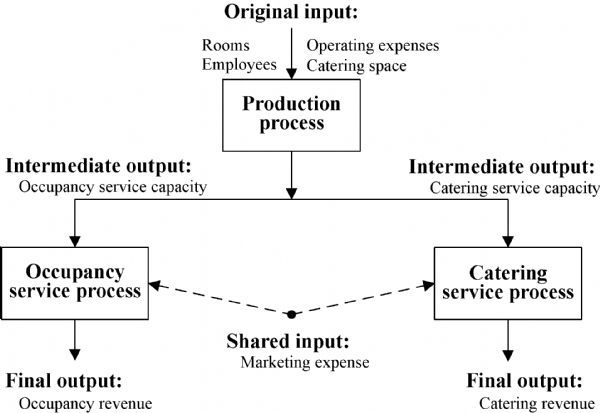
| Abstract: Unreasonable allocation of shared resources reduces the system efficiency and is a considerable operational risk. Sub-processes with insufficient portion of shared resources could not help accomplish complicated tasks, and overstaffing and idle resources will occur in the sub-processes assigned with redundant shared resources. This unfair portion distribution may cause internal contradictions among sub-processes and even lead to the collapsing of the entire system. This study proposes a data-driven, mixed two-stage network data envelopment analysis model. This method aims to reasonably define the allocation portion of shared extra intermediate resources among several nonhomogeneous subsystems and measure the overall system performance. A data set of 58 international hotels is used to test the features of the proposed model. |
| Keywords
shared resource allocation
mixed two-stage system
data envelopment analysis
efficiency
|
|
最新录用日期:
在线预览日期:
发布日期: 2020-05-27
|
|
|
| 1 |
G R Amin, M Toloo (2004). A polynomial-time algorithm for finding e in DEA models. Computers & Operations Research, 31(5): 803–805
https://doi.org/10.1016/S0305-0548(03)00072-8
|
| 2 |
A Amirteimoori (2013). A DEA two-stage decision processes with shared resources. Central European Journal of Operations Research, 21(1): 141–151
https://doi.org/10.1007/s10100-011-0218-3
|
| 3 |
Q An, F Meng, B Xiong, Z Wang, X Chen (2018). Assessing the relative efficiency of Chinese high-tech industries: A dynamic network data envelopment analysis approach. Annals of Operations Research: 1–23
https://doi.org/10.1007/s10479-018-2883-2
|
| 4 |
Q An, X Tao, B Dai, J Li (2019). Modified distance friction minimization model with undesirable output: An application to the environmental efficiency of China’s regional industry. Computational Economics: 1–25
https://doi.org/10.1007/s10614-019-09888-w
|
| 5 |
J E Beasley (1995). Determining teaching and research efficiencies. Journal of the Operational Research Society, 46(4): 441–452
https://doi.org/10.1057/jors.1995.63
|
| 6 |
Y Bian, M Hu, H Xu (2015). Measuring efficiencies of parallel systems with shared inputs/outputs using data envelopment analysis. Kybernetes, 44(3): 336–352
https://doi.org/10.1108/K-04-2014-0067
|
| 7 |
B Brunaud, M P Ochoa, I E Grossmann (2018). Product decomposition strategy for optimization of supply chain planning. Frontiers of Engineering Management, 5(4): 466–478
https://doi.org/10.15302/J-FEM-2018059
|
| 8 |
A Charnes, W W Cooper (1962). Programming with linear fractional functionals. Naval Research Logistics Quarterly, 9(3–4): 181–186
https://doi.org/10.1002/nav.3800090303
|
| 9 |
A Charnes, W W Cooper, E Rhodes (1978). Measuring the efficiency of decision making units. European Journal of Operational Research, 2(6): 429–444
https://doi.org/10.1016/0377-2217(78)90138-8
|
| 10 |
Y Chen, W D Cook, J Zhu (2014). Additive efficiency decomposition in network DEA. In: Cook W, Zhu J, eds. Data Envelopment Analysis. International Series in Operations Research and Management Science.Boston, MA: Springer, 208: 91–118
|
| 11 |
Y Chen, J Du, H D Sherman, J Zhu (2010). DEA model with shared resources and efficiency decomposition. European Journal of Operational Research, 207(1): 339–349
https://doi.org/10.1016/j.ejor.2010.03.031
|
| 12 |
Y Chen, L Liang, F Yang, J Zhu (2006). Evaluation of information technology investment: A data envelopment analysis approach. Computers & Operations Research, 33(5): 1368–1379
https://doi.org/10.1016/j.cor.2004.09.021
|
| 13 |
W D Cook, M Hababou (2001). Sales performance measurement in bank branches. Omega, 29(4): 299–307
https://doi.org/10.1016/S0305-0483(01)00025-1
|
| 14 |
W D Cook, J Harrison, R Imanirad, P Rouse, J Zhu (2013). Data envelopment analysis with nonhomogeneous DMUs. Operations Research, 61(3): 666–676
https://doi.org/10.1287/opre.2013.1173
|
| 15 |
W D Cook, J Harrison, P Rouse, J Zhu (2012). Relative efficiency measurement: The problem of a missing output in a subset of decision making units. European Journal of Operational Research, 220(1): 79–84
https://doi.org/10.1016/j.ejor.2012.01.022
|
| 16 |
W D Cook, L Liang, J Zhu (2010). Measuring performance of two-stage network structures by DEA: A review and future perspective. Omega, 38(6): 423–430
https://doi.org/10.1016/j.omega.2009.12.001
|
| 17 |
W D Cook, H J H Tuenter (2000). Multicomponent efficiency measurement and shared inputs in data envelopment analysis: An application to sales and service performance in bank branches. Journal of Productivity Analysis, 14(3): 209–224
https://doi.org/10.1023/A:1026598803764
|
| 18 |
J Du, Y Chen, J Huo (2015). DEA for non-homogenous parallel networks. Omega, 56: 122–132
https://doi.org/10.1016/j.omega.2014.10.001
|
| 19 |
G E Halkos, N G Tzeremes, S A Kourtzidis (2014). A unified classification of two-stage DEA models. Surveys in Operations Research and Management Science, 19(1): 1–16
https://doi.org/10.1016/j.sorms.2013.10.001
|
| 20 |
C W Huang, F N Ho, Y H Chiu (2014). Measurement of tourist hotels’ productive efficiency, occupancy, and catering service effectiveness using a modified two-stage DEA model in Taiwan. Omega, 48: 49–59
https://doi.org/10.1016/j.omega.2014.02.005
|
| 21 |
R Imanirad, W D Cook, S V Aviles-Sacoto, J Zhu (2015). Partial input to output impacts in DEA: The case of DMU-specific impacts. European Journal of Operational Research, 244(3): 837–844
https://doi.org/10.1016/j.ejor.2015.02.002
|
| 22 |
R Imanirad, W D Cook, J Zhu (2013). Partial input to output impacts in DEA: Production considerations and resource sharing among business subunits. Naval Research Logistics, 60(3): 190–207
https://doi.org/10.1002/nav.21528
|
| 23 |
G R Jahanshahloo, A R Amirteimoori, S Kordrostami (2004a). Measuring the multi-component efficiency with shared inputs and outputs in data envelopment analysis. Applied Mathematics and Computation, 155(1): 283–293
https://doi.org/10.1016/S0096-3003(03)00780-X
|
| 24 |
G R Jahanshahloo, A R Amirteimoori, S Kordrostami (2004b). Multi-component performance, progress and regress measurement and shared inputs and outputs in DEA for panel data: An application in commercial bank branches. Applied Mathematics and Computation, 151(1): 1–16
https://doi.org/10.1016/S0096-3003(03)00318-7
|
| 25 |
C Kao (2012). Efficiency decomposition for parallel production systems. Journal of the Operational Research Society, 63(1): 64–71
https://doi.org/10.1057/jors.2011.16
|
| 26 |
C Kao (2014). Network data envelopment analysis: A review. European Journal of Operational Research, 239(1): 1–16
https://doi.org/10.1016/j.ejor.2014.02.039
|
| 27 |
C Kao, S N Hwang (2008). Efficiency decomposition in two-stage data envelopment analysis: An application to non-life insurance companies in Taiwan. European Journal of Operational Research, 185(1): 418–429
https://doi.org/10.1016/j.ejor.2006.11.041
|
| 28 |
C Kao, S N Hwang (2010). Efficiency measurement for network systems: IT impact on firm performance. Decision Support Systems, 48(3): 437–446
https://doi.org/10.1016/j.dss.2009.06.002
|
| 29 |
W Li, L Liang, W D Cook, J Zhu (2016). DEA models for non-homogeneous DMUs with different input configurations. European Journal of Operational Research, 254(3): 946–956
https://doi.org/10.1016/j.ejor.2016.04.063
|
| 30 |
W H Li, L Liang, S V Avilés-Sacoto, R Imanirad, W D Cook, J Zhu (2017). Modeling efficiency in the presence of multiple partial input to output processes. Annals of Operations Research, 250(1): 235–248
https://doi.org/10.1007/s10479-015-2006-2
|
| 31 |
Y Li, Y Chen, L Liang, J Xie (2014). DEA models for extended two-stage network structures. In: Cook W, Zhu J, eds. Data Envelopment Analysis. International Series in Operations Research and Management Science. Boston, MA: Springer, 208: 261–284
https://doi.org/10.1007/978-1-4899-8068-7_12
|
| 32 |
L Liang, W D Cook, J Zhu (2008). DEA models for two-stage processes: Game approach and efficiency decomposition. Naval Research Logistics, 55(7): 643–653
https://doi.org/10.1002/nav.20308
|
| 33 |
L Liang, F Yang, W D Cook, J Zhu (2006). DEA models for supply chain efficiency evaluation. Annals of Operations Research, 145(1): 35–49
https://doi.org/10.1007/s10479-006-0026-7
|
| 34 |
N Rogge, S De Jaeger (2012). Evaluating the efficiency of municipalities in collecting and processing municipal solid waste: A shared input DEA-model. Waste Management, 32(10): 1968–1978
https://doi.org/10.1016/j.wasman.2012.05.021
pmid: 22687708
|
| 35 |
L M Seiford, J Zhu (1999). Profitability and marketability of the top 55 US commercial banks. Management Science, 45(9): 1270–1288
https://doi.org/10.1287/mnsc.45.9.1270
|
| 36 |
M Song, S Zhu, J Wang, J Zhao (2020). Share green growth: Regional evaluation of green output performance in China. International Journal of Production Economics, 219: 152–163
https://doi.org/10.1016/j.ijpe.2019.05.012
|
| 37 |
Y M Wang, K S Chin (2010). Some alternative DEA models for two-stage process. Expert Systems with Applications, 37(12): 8799–8808
https://doi.org/10.1016/j.eswa.2010.06.024
|
| 38 |
J Wu, Q Zhu, J Chu, H Liu, L Liang (2016a). Measuring energy and environmental efficiency of transportation systems in China based on a parallel DEA approach. Transportation Research Part D: Transport and Environment, 48: 460–472
https://doi.org/10.1016/j.trd.2015.08.001
|
| 39 |
J Wu, Q Zhu, X Ji, J Chu, L Liang (2016b). Two-stage network processes with shared resources and resources recovered from undesirable outputs. European Journal of Operational Research, 251(1): 182–197
https://doi.org/10.1016/j.ejor.2015.10.049
|
| 40 |
X Yang, W Heidug, D Cooke (2019). An adaptive policy-based framework for China’s Carbon Capture and Storage development. Frontiers of Engineering Management, 6(1): 78–86
https://doi.org/10.1007/s42524-019-0003-x
|
| 41 |
P Yin, J Chu, J Wu, J Ding, M Yang, Y Wang (2019). A DEA-based two-stage network approach for hotel performance analysis: An internal cooperation perspective. Omega (In Press)
https://doi.org/10.1016/j.omega.2019.02.004
|
| 42 |
M M Yu, C K Fan (2009). Measuring the performance of multimode bus transit: A mixed structure network DEA model. Transportation Research Part E: Logistics and Transportation Review, 45(3): 501–515
https://doi.org/10.1016/j.tre.2008.10.001
|
| 43 |
M M Yu, E T J Lin (2008). Efficiency and effectiveness in railway performance using a multi-activity network DEA model. Omega, 36(6): 1005–1017
https://doi.org/10.1016/j.omega.2007.06.003
|
| 44 |
Y Zha, L Liang (2010). Two-stage cooperation model with input freely distributed among the stages. European Journal of Operational Research, 205(2): 332–338
https://doi.org/10.1016/j.ejor.2010.01.010
|
| 45 |
L Zhen, D Zhuge, L Murong, R Yan, S Wang (2019). Operation management of green ports and shipping networks: Overview and research opportunities. Frontiers of Engineering Management, 6(2): 152–162
https://doi.org/10.1007/s42524-019-0027-2
|
| 46 |
W Zhu, Y Yu, P Sun (2018). Data envelopment analysis cross-like efficiency model for non-homogeneous decision-making units: The case of United States companies’ low-carbon investment to attain corporate sustainability. European Journal of Operational Research, 269(1): 99–110
https://doi.org/10.1016/j.ejor.2017.08.007
|
|
Viewed |
|
|
|
Full text
|
|
|
|
|
Abstract
|
|
|
|
|
Cited |
|
|
|
|
| |
Shared |
|
|
|
|
| |
Discussed |
|
|
|
|