Please wait a minute...
 首页  期刊列表 期刊订阅 开放获取 关于我们
English
在线预览  |  当期目录  |  过刊浏览  |  热点文章  |  下载排行
Frontiers of Engineering Management    2019, Vol. 6 Issue (1) : 19-37     https://doi.org/10.1007/s42524-019-0007-6
RESEARCH ARTICLE
Sufficient or insufficient: Assessment of the intended nationally determined contributions (INDCs) of the world’s major greenhouse gas emitters
Ge GAO1, Mo CHEN1, Jiayu WANG1, Kexin YANG1, Yujiao XIAN2, Xunpeng SHI3, Ke WANG4()
1. Center for Energy and Environmental Policy Research, Beijing Institute of Technology, Beijing 100081, China; School of Management and Economics, Beijing Institute of Technology, Beijing 100081, China
2. Center for Energy and Environmental Policy Research, Beijing Institute of Technology, Beijing 100081, China; School of Management and Economics, Beijing Institute of Technology, Beijing 100081, China; Productivity and Efficiency Measurement Laboratory, Department of Industrial and Systems Engineering, Texas A&M University, College Station, Texas, USA
3. Australia-China Relations Institute, University of Technology Sydney, Ultimo, NSW, Australia; Energy Studies Institute, National University of Singapore, Singapore
4. Center for Energy and Environmental Policy Research, Beijing Institute of Technology, Beijing 100081, China; School of Management and Economics, Beijing Institute of Technology, Beijing 100081, China; Beijing Key Lab of Energy Economics and Environmental Management, Beijing 100081, China; Sustainable Development Research Institute for Economy and Society of Beijing, Beijing 100081, China
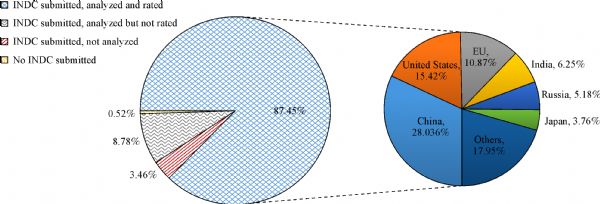
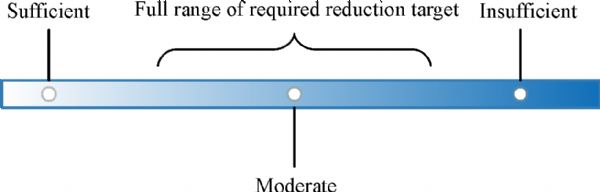
全文: PDF(1019 KB)   HTML
导出: BibTeX | EndNote | Reference Manager | ProCite | RefWorks
Abstract

The recent Conference of the Parties of the United Nations Framework Convention on Climate Change has resulted in the submission of the Intended Nationally Determined Contributions (INDCs) of 190 countries. This study aims to provide an analysis of the ambitiousness and fairness of the mitigation components of the INDCs submitted by various parties. We use a unified framework to assess 23 INDCs that cover 50 countries, including European Union (EU)-28 countries as parties to the Convention, which represent 87.45% of the global greenhouse gas emissions in 2012. First, we transform initial INDC files into reported reduction targets. Second, we create four schemes and six scenarios to determine the required reduction effort, which considers each nation’s reduction responsibility, capacity, and potential, thereby reflecting their historical and current development status. Finally, we combine the reported reduction target and the required reduction effort to assess INDCs. Evaluation results of the 23 emitters indicate that 2 emitters (i.e., EU and Brazil) are rated as “sufficient,” 7 emitters (e.g., China, the United States, and Canada) are rated as “moderate,” and 14 emitters (e.g., India, Russia, and Japan) are rated as “insufficient.” Most pledges exhibit a considerable distance from representing a fair contribution.

Keywords Intended Nationally Determined Contributions      mitigation      responsibility      capacity      potential     
在线预览日期:    发布日期: 2019-03-12
服务
推荐给朋友
免费邮件订阅
RSS订阅
作者相关文章
Ge GAO
Mo CHEN
Jiayu WANG
Kexin YANG
Yujiao XIAN
Xunpeng SHI
Ke WANG
引用本文:   
Ge GAO,Mo CHEN,Jiayu WANG, et al. Sufficient or insufficient: Assessment of the intended nationally determined contributions (INDCs) of the world’s major greenhouse gas emitters[J]. Front. Eng, 2019, 6(1): 19-37.
网址:  
https://journal.hep.com.cn/fem/EN/10.1007/s42524-019-0007-6     OR     https://journal.hep.com.cn/fem/EN/Y2019/V6/I1/19
Fig.1  Major countries that have submitted INDCs and their global emission shares in 2012
Fig.2  Assessment process
Fig.3  Rating criteria
Abbreviation Country Projected BAU emissions (MtCO2) Absolute emission reduction (MtCO2) Percentage emission reduction with respect to 2030 BAU (%)
CN China 13457.25 1457.25 10.83
US United States 6864.83 3002.14 43.73
EU-28 EU-28 5423.99 2910.97 53.67
IN India 5082.93 - 917.07 - 18.04
RU Russian Federation 2011.40 388.74 19.33
JP Japan 1360.89 428.79 31.51
KR Korea, Republic of 815.40 279.52 34.28
IR Iran 784.46 9.74 1.24
CA Canada 1022.23 630.50 61.68
SA Saudi Arabia 634.40 - -
BR Brazil 870.77 673.26 77.32
MX Mexico 949.20 170.69 17.98
ID Indonesia 602.46 −494.22 - 82.03
AU Australia 736.57 237.18 32.20
ZA South Africa 1127.21 513.21 45.53
TR Turkey 499.17 174.88 35.03
UA Ukraine 334.52 −85.30 −25.50
TH Thailand 360.77 −133.99 −37.14
KZ Kazakhstan 273.84 69.87 25.51
EG Egypt 646.55 - -
MY Malaysia 274.59 −215.01 −78.30
VN Venezuela 426.81 299.83 70.25
AR Argentina 377.44 241.31 63.93
AE United Arab Emirates 239.50 - -
VN Vietnam 387.60 187.98 48.50
DZ Algeria 228.60 −126.45 −55.31
PK Pakistan 201.03 - -
UZ Uzbekistan 135.58 - -
Tab.1  Reported reduction targets from INDCs (top–down in descending order of emission shares in 2012)
Scenario RoSE 111 RoSE 121 RoSE 131 RoSE 141 RoSE 161 RoSE 171
Element Med Growth
Fast Conv
Med Pop
Med Fossils
Slow Growth
Fast Conv
Med Pop
Med Fossils
Fast Growth
Fast Conv
Med Pop
Med Fossils
Slow Growth
Slow Conv
High Pop
Med Fossils
Med Growth
Fast Conv
Med Pop
High Fossils
Med Growth
Fast Conv
Med Pop
Low Fossils
Tab.2  RoSE scenario matrix
Fig.4  CO2 emissions in six global BAU scenarios
Fig.5  Global emissions under RCP2.6, RCP4.5, and RCP8.5
Dimension Indicators Principle Interpretation
Carbon emission reduction responsibility Cumulative CO2 emissions Polluter pays Countries with higher historical emissions should bear more emission reduction effort
Per capita CO2 emissions
CO2 emissions in 2012
Carbon emission reduction capacity Per capita GDP Vertical Rich countries should assume more emission reduction effort
Human Development Index
Carbon emission reduction potential Carbon intensity Development level Countries with more reduction space should reduce more emissions
Proportion of coal consumption to total energy consumption
Tab.3  Emission reduction index system of the required reduction effort
D W A: average weighting scheme B: responsibility-oriented scheme C: capacity-oriented scheme D: potential-oriented scheme
D W1 1/3 3/5 1/5 1/5
D W2 1/3 1/5 3/5 1/5
D W3 1/3 1/5 1/5 3/5
Tab.4  DWs of the four schemes
Abbreviation Parties RoSE 111 (%) RoSE 121 (%) RoSE 131 (%) RoSE 141 (%) RoSE 161 (%) RoSE 171 (%)
A B C D A B C D A B C D A B C D A B C D A B C D
CN China 15 20 9 15 14 20 9 15 15 21 10 16 12 16 7 12 14 20 9 15 11 16 7 12
US United States 35 45 40 23 34 43 38 22 37 47 42 24 28 36 32 19 35 44 39 23 27 34 31 18
EU-28 EU-28 30 38 33 20 29 37 31 20 31 40 34 21 24 31 26 16 29 37 32 20 23 29 25 16
IN India 18 18 11 24 17 17 10 23 18 19 11 25 14 15 9 19 17 18 10 24 13 14 8 18
RU Russian Federation 40 49 34 40 39 47 33 38 42 51 36 42 32 39 27 32 40 48 34 39 31 37 26 30
JP Japan 102 95 131 79 98 91 126 76 107 99 137 82 82 76 105 63 100 93 129 77 78 73 100 60
KR Korea, South 136 120 163 123 131 115 156 118 142 126 170 128 109 97 131 99 134 118 160 120 104 92 124 94
IR Iran 66 66 58 75 64 63 56 72 69 69 61 78 53 53 47 60 65 64 57 74 51 50 45 57
CA Canada 101 90 145 65 97 87 138 62 105 94 151 68 81 73 116 52 99 89 142 64 77 69 111 50
SA Saudi Arabia 122 121 159 86 117 116 152 83 128 127 166 90 98 98 128 69 120 119 156 85 94 93 122 66
BR Brazil 27 25 33 22 26 24 32 21 28 26 34 23 22 20 27 18 26 25 32 22 21 19 25 17
MX Mexico 32 30 39 26 30 28 37 25 33 31 41 27 25 24 31 21 31 29 38 26 24 23 30 20
ID Indonesia 90 74 65 129 87 71 62 123 94 78 68 134 73 60 52 103 89 73 64 126 69 57 50 99
AU Australia 174 147 220 151 167 141 211 144 182 153 229 157 140 118 177 121 171 144 216 148 133 112 168 115
ZA South Africa 68 55 50 98 66 53 48 94 71 57 52 102 55 44 40 79 67 54 49 96 52 42 38 75
TR Turkey 116 93 117 135 112 89 112 130 122 97 122 141 94 75 94 109 114 92 115 133 89 71 89 103
UA Ukraine 239 195 167 348 229 187 160 333 250 203 175 363 192 157 134 280 235 191 164 342 183 149 128 266
TH Thailand 120 100 109 147 115 96 105 141 125 104 114 153 96 80 88 118 118 98 107 144 92 76 84 112
KZ Kazakhstan 409 333 300 580 392 320 287 556 427 348 313 606 328 268 241 466 401 327 294 570 313 255 229 444
EG Egypt 33 27 28 44 32 26 27 42 35 28 29 46 27 22 22 35 33 26 27 43 25 21 21 34
MY Malaysia 182 148 152 238 174 142 146 228 189 154 159 249 146 119 122 191 178 145 150 234 139 113 117 182
VN Venezuela 64 58 75 57 61 55 72 55 67 60 79 60 51 46 61 46 63 57 74 56 49 44 58 44
AR Argentina 69 58 95 51 66 56 91 49 72 61 99 53 55 47 76 41 67 57 93 50 52 44 72 39
AE United Arab Emirates 369 342 510 250 354 327 489 240 386 356 533 261 297 274 410 201 363 335 501 246 283 261 390 192
DZ Algeria 49 40 55 51 47 38 52 49 51 41 57 54 39 32 44 41 48 39 54 50 38 30 42 39
VN Vietnam 251 180 167 392 240 173 160 376 262 188 174 409 201 145 134 315 246 177 164 385 192 138 128 300
PK Pakistan 90 66 50 149 86 63 48 142 94 69 52 155 72 53 40 119 88 65 49 146 69 51 38 114
UZ Uzbekistan 448 335 293 697 429 321 280 668 468 350 305 727 360 269 235 560 440 329 287 684 343 256 224 533
Tab.5  Required reduction efforts of 28 nations
Fig.6  Percentage emission reduction with respect to BAU (left to right in descending order of emission shares in 2012)
Fig.7  Assessment result (top–down in descending order of emission shares in 2012)
No. Code Countries Rating
1 CN China medium
2 US United States medium
3 EU-28 EU-28 sufficient
4 IN India inadequate
5 RU Russian Federation inadequate
6 JP Japan inadequate
7 KR South Korea inadequate
8 IR Iran inadequate
9 CA Canada medium
10 BR Brazil sufficient
11 MX Mexico inadequate
12 ID Indonesia inadequate
13 AU Australia inadequate
14 ZA South Africa medium
15 TR Turkey inadequate
16 UA Ukraine inadequate
17 TH Thailand inadequate
18 KZ Kazakhstan inadequate
19 MY Malaysia inadequate
20 VE Venezuela medium
21 AR Argentina medium
22 DZ Algeria medium
23 VN Vietnam inadequate
Tab.6  Final rating of the INDCs of the 23 parties
Country 2012 emission share Included in the analysis Emission reduction target
Base year Reduction form Target year
China 28.03% A 2005 Emission peak 2030 (or before)
60%–65%
(carbon intensity)
United States 15.42% A 2005 26%–28% 2025
EU 10.87% A 1990 40% 2030
India 6.25% A 2005 33%–55%
(emission intensity)
2030
Russia 5.18% A 1990 25%–30% 2030
Japan 3.76% A 2005 25.40% 2030
South Korea 1.86% A BAU 37% 2030
Iran 1.79% A BAU 4% 2030
12% (c)
Canada 1.63% A 2005 30% 2030
Saudi Arabia 1.45% B Mitigation actions only
Brazil 1.44% A 2005 37% 2025
Mexico 1.39% A BAU 25% 2030
40% (c)
Indonesia 1.37% A BAU 29% 2030
41% (c)
Australia 1.18% A 2005 26%–28% 2030
South Africa 1.15% A Emission peak 2025
(398–614 Mt CO2e)
Turkey 1.00% A BAU 21% 2030
Ukraine 0.86% A 1990 40% 2030
Thailand 0.82% A BAU 20% 2030
25% (c)
Kazakhstan 0.71% A 1990 15% 2030
25% (c)
Egypt 0.66% B Mitigation actions only
Malaysia 0.63% A 2005 35%
(emission intensity)
2030
45% (c)
Venezuela 0.62% A BAU 20% (c) 2030
Argentina 0.59% A BAU 15% 2030
30% (c)
United Arab Emirates 0.55% B Mitigation actions only
Vietnam 0.52% A BAU 8% 2030
25% (c)
Pakistan 0.46% B Mitigation actions only
Algeria 0.40% A BAU 7% 2030
Up to 22% (c)
Uzbekistan 0.35% B Mitigation actions only
Philippines 0.26% C BAU 70% 2030
Chile 0.24% C 2007 30%
(carbon intensity)
2030
35%–45% (c)
(carbon intensity)
Qatar 0.24% C Mitigation actions only
Israel 0.23% C 2005 8.8t CO2e per capita 2025
7.7t CO2e per capita 2030
Belarus 0.22% C 1990 28% 2030
Oman 0.21% C Mitigation actions only
Colombia 0.22% C BAU 20% 2030
30% (c)
Nigeria 0.28% C BAU 20% 2030
45% (c)
Turkmenistan 0.20% C Mitigation actions only
Bangladesh 0.19% C BAU 5% 2030
15% (c)
Morocco 0.16% C BAU 13% 2030
32% (c)
Singapore 0.15% C 2005 Emission peak 2030
36%
(emission intensity)
Peru 0.15% C BAU 20% 2030
30% (c)
Serbia 0.13% C 1990 9.80% 2030
Switzerland 0.13% C 1990 35% 2025
50% 2030
Trinidad and Tobago 0.12% C BAU 30%
(public transport only)
2030
15% (c)
(total GHG emissions)
Norway 0.12% C 1990 At least 40% 2030
Ecuador 0.11% C BAU 20.4%–25% 2025
37.5%–45.8% (c)
New Zealand 0.10% C 2005 30% 2030
Azerbaijan 0.10% C 1990 35% 2030
Cuba 0.09% C Mitigation actions only
Bahrain 0.09% C List of actions
Tunisia 0.07% C 2010 13%
(carbon intensity)
2030
41% (c)
(carbon intensity)
Jordan 0.07% C BAU 1.5% 2030
14% (c)
Bosnia and Herzegovina 0.00% C BAU 2% 2030
23% (c)
Lebanon 0.06% C BAU 15% 2030
30% (c)
Yemen 0.06% C BAU 1% 2030
14% (c)
Dominican Republic 0.06% C 2010 25% 2030
Angola 0.06% C BAU 20% and 35% (c) 2025
27% and 50% (c) 2030
Bolivia 0.05% C Mitigation actions only
Afghanistan 0.03% C BAU 13.6% (c) 2030
Albania 0.01% C BAU 11.50% 2030
Andorra 0.01% C BAU 37% 2030
Antigua and Barbuda 0.01% C Mitigation actions only
Armenia 0.00% C Mitigation actions only
Bahamas 0.00% C Mitigation actions only
Barbados 0.00% C BAU 37% (interim) 2025
44% 2030
Benin 0.01% C BAU 3.5% 2030
21.4% (c)
Belize 0.00% C Mitigation actions only
Bhutan 0.00% C Mitigation actions only
Botswana 0.00% C 2010 15% 2030
Brunei 0.03% C Energy, transport, and forestry sector emission reduction targets
Burkina Faso C BAU 6.6% 2030
Burundi 0.00% C BAU 18.2% (c) 2030
3%
Cabo Verde 0.00% C Mitigation actions only
Cambodia 0.00% C Mitigation actions only
Cameroon 0.00% C BAU 32% 2035
Central African Republic 0.00% C BAU 5% (c) 2030
Chad 0.00% C BAU 18.2% 2030
71% (c)
Comoros 0.00% C BAU 84% (c) 2030
Congo 0.00% C BAU 48% 2025
55% 2035
Cook Islands 0.00% C 2006 38% 2020
81% (c)
Costa Rica 0.00% C Net emission limit 9.374 MtCO2e 2030
BAU 44%
2012 25%
Côte D’Ivoire 0.00% C BAU 28% 2030
Democratic Republic of Congo (DRC) 0.00% C 2000 17% (c) 2030
Djibouti 0.00% C BAU 40% 2030
60% (c)
Dominica 0.00% C 2014 39.2% (c) 2025
44.7% (c) 2030
El Salvador 0.00% C Mitigation actions only
Equatorial Guinea 0.00% C 2010 20% (c) 2030
Eritrea 0.00% C 2010 39.2% 2030
80.6% (c)
Ethiopia 0.00% C BAU 64% (c) 2030
Fiji 0.00% C Mitigation actions only
FYROM (Macedonia) 0.00% C BAU 30%–36% 2030
Gabon 0.00% C BAU 50% 2025
Gambia 0.00% C BAU 44.40% 2025
Georgia 0.00% C BAU 15% 2030
Ghana 0.00% C BAU 15% 2030
Grenada 0.00% C 2010 30% 2025
40% (indicative) 2030
Guatemala 0.00% C BAU 11.2% (c) 2030
22.6%
Guinea 0.00% C Mitigation actions only, energy target of 30%
Guinea-Bissau 0.00% C Mitigation actions only
Guyana 0.00% C Mitigation actions only
Haiti 0.00% C BAU 5% 2030
26% (c)
Honduras 0.00% C BAU 15% (c) 2030
Iceland 0.00% C 1990 40% 2030
Kenya 0.00% C BAU 30% (c) 2030
Kiribati 0.00% C BAU 13.70% 2025
12.80% 2030
Kyrgyz Republic 0.00% C BAU 11.49%–13.75%
29%–30.89% (c)
2030
12.67%–15.69%
35.06%–36.75% (c)
2050
Lao 0.00% C Mitigation actions only
Lesotho 0.00% C BAU 10% 2030
35% (c)
Liberia 0.00% C Mitigation actions only
Liechtenstein 0.00% C 1990 40% 2030
Madagascar 0.00% C BAU 14% 2030
Malawi 0.00% C Mitigation actions only
Maldives 0.00% C BAU 10% 2030
24% (c)
Mali 0.00% C BAU 29% (agriculture) 2030
31% (energy)
21% (forestry)
Marshall Islands 0.00% C 2010 32% 2025
Mauritania 0.00% C BAU 2.7% 2030
22.3% (c)
Mauritius 0.00% C BAU 30% 2030
Micronesia 0.00% C 2000 28% 2025
Moldova 0.00% C 1990 64%–67% 2030
78% (c)
Monaco 0.00% C 1990 40% (optional) 2025
50% 2030
Mongolia 0.00% C Mitigation actions only
Montenegro 0.00% C 1990 30% 2030
Mozambique 0.00% C - 76.5 Mt CO2e 2020–2030
Myanmar 0.00% C Conditional actions only
Namibia 0.00% C BAU 89% 2030
Nauru 0.00% C Energy target; mitigation actions
Niue 0.00% C At least 80% (c) 2050
Niger 0.00% C BAU 2.5% 2030
Paraguay 0.00% C BAU 10% 2030
Papua New Guinea 0.00% C 100% renewable energy target by 2030
Rwanda 0.00% C Mitigation actions only
Samoa 0.00% C Mitigation actions only
San Marino 0.00% C 2005 20% 2030
Sao Tome and Principe 0.00% C BAU 24% 2030
Senegal 0.00% C BAU 3% or 7%(c) 2020
4% or 15%(c) 2025
5% or 21% (c) 2030
Seychelles 0.00% C BAU 21.40% 2025
29% 2030
Sierra Leone 0.00% C Mitigation actions only
Solomon Islands 0.00% C 2015 12% or 27% (c) 2025
30% or 45% (c) 2030
Somalia 0.00% C Mitigation actions only
South Sudan 0.00% C List of actions
Sri Lanka 0.00% C BAU 7% 2030
23% (c)
St. Kitts and Nevis 0.00% C BAU 22% 2025
St. Lucia 0.00% C BAU 16% 2025
St. Vincent and the Grenadines 0.00% C BAU 22% 2025
Sudan 0.00% C List of actions
Suriname 0.00% C Mitigation actions only
Swaziland 0.00% C Mitigation actions only
Tajikistan 0.00% C 1990 10%–20% 2030
25%–35% (c)
Tanzania 0.00% C BAU 10%–20% 2030
Togo 0.00% C BAU 11.14% 2030
31.14% (c)
Tonga 0.00% C Energy goals 2030
Uganda 0.00% C Mitigation actions only
Uruguay 0.00% C Mitigation actions only
Zambia 0.00% C BAU 25 or 47% (c) 2030
Zimbabwe 0.00% C BAU 33% (per capita) (c) 2030
  Supplementary A Mitigation aspect of INDCs (in order of emission shares in 2012)
1 PBaer, T Athanasiou, SKartha, EKemp-Benedict (2009). Greenhouse development rights: A proposal for a fair global climate treaty. Ethics Place and Environment, 12(3): 267–281
https://doi.org/10.1080/13668790903195495
2 D Pvan Vuuren, EStehfest, M G Jden Elzen, TKram, J van Vliet, SDeetman, MIsaac, KKlein G, AHof, A Mendoza B, ROostenrijk, Bvan R (2011). RCP2.6: exploring the possibility to keep global mean temperature increase below 2°C. Climatic Change, 109(1-2): 95–116
https://doi.org/10.1007/s10584-011-0152-3
3 BP (2016). Statistical review of world energy.
4 Climate Action Tracker (2016). Assessment of mitigation contributions to the Paris Agreement., 2016–10–3
5 MDavide, P Vesco (2016). Alternative approaches for rating INDCs: A comparative analysis. FEEM Working Paper No. 018.2016. , 2016–11–5
6 Mden Elzen, A Admiraal, MRoelfsema, Hvan Soest, A FHof, NForsell (2016). Contribution of the G20 economies to the global impact of the Paris agreement climate proposals. Climatic Change, 137(3-4): 1–11
https://doi.org/10.1007/s10584-016-1700-7
7 DESAUN (2015). World population prospects, the 2015 revision.
8 NHöhne, M den Elzen, DEscalante (2014). Regional GHG reduction targets based on effort sharing: A comparison of studies. Climate Policy, 14(1): 122–147
https://doi.org/10.1080/14693062.2014.849452
9 Joint Global Change Research Institute (2015). Global Change Assessment Model v4.2., 2016–9-28
10 MMeinshausen, S J Smith, K Calvin, J SDaniel, M L TKainuma, J FLamarque, KMatsumoto, S AMontzka, S C BRaper, KRiahi, AThomson, G J MVelders, D P Pvan Vuuren (2011). The RCP greenhouse gas concentrations and their extensions from 1765 to 2300. Climatic Change, 109(1-2): 213–241
https://doi.org/10.1007/s10584-011-0156-z
11 R HMoss, J A Edmonds, K A Hibbard, M R Manning, S K Rose, D P van Vuuren, T R Carter, S Emori, MKainuma, TKram, G A Meehl, J F Mitchell, N Nakicenovic, KRiahi, S JSmith, R JStouffer, A MThomson, J PWeyant, T JWilbanks (2010). The next generation of scenarios for climate change research and assessment. Nature, 463(7282): 747–756
https://doi.org/10.1038/nature08823 pmid: 20148028
12 H EOtt, H Winkler, BBrouns (2004). South–north dialogue on equity in the greenhouse: A proposal for an adequate and equitable global climate agreements., 2016–4-10
13 GPhylipsen, J W Bode, K Blok, HMerkus, BMetz (1998). A triptych sectoral approach to burden differentiation; GHG emissions in the European bubble. Energy Policy, 26(12): 929–943
https://doi.org/10.1016/S0301-4215(98)00036-6
14 LRingius, A Torvanger, BHoltsmark (1998). Can multi-criteria rules fairly distribute climate burdens? OECD results from three burden sharing rules. Energy Policy, 26(10): 777–793
https://doi.org/10.1016/S0301-4215(98)00032-9
15 JRogelj, M den Elzen, NHöhne, TFransen, HFekete, HWinkler, RSchaeffer, FSha, K Riahi, MMeinshausen (2016). Paris Agreement climate proposals need a boost to keep warming well below 2°C. Nature, 534(7609): 631–639
https://doi.org/10.1038/nature18307 pmid: 27357792
16 UNDP (2015). Human Development Data (1990–2012).
17 UNEP (2015). The Emissions Gap Report 2015: A UNEP Synthesis Report., 2016–11–17
18 UNFCCC (1997). Proposed elements of a protocol to the United Nations framework convention on climate change., 2016–3-10
19 UNFCCC (2015). Synthesis report on the aggregate effect of the intended nationally determined contributions., 2016–12–25
20 UNFCCC (2016). Intended nationally determined contributions (INDCs)., 2016–12–13
21 D Pvan Vuuren, M G Jden Elzen, P LLucas, BEickhout, B JStrengers, Bvan Ruijven, SWonink, Rvan Houdt (2007). Stabilizing greenhouse gas concentrations at low levels: An assessment of reduction strategies and costs. Climatic Change, 81(2): 119–159
https://doi.org/10.1007/s10584-006-9172-9
22 D Pvan Vuuren, EStehfest, M G Jden Elzen, TKram, J van Vliet, SDeetman, MIsaac, K KKlein Goldewijk, AHof, K Wang, Y JXian, J MZhang, YLi, L N Che (2016). Potential carbon emission abatement cost recovery from carbon emission trading in China: an estimation of industry sector. Journal of Modelling in Management, 11(3): 842–854
https://doi.org/10.1108/JM2-03-2016-0027
23 KWang, X Zhang, Y MWei, SYu (2013). Regional allocation of CO2 emissions allowance over provinces in china by 2020. Energy Policy, 54: 214–229
https://doi.org/10.1016/j.enpol.2012.11.030
24 HWinkler, K Baumert, OBlanchard, SBurch, JRobinson (2007). What factors influence mitigative capacity? Energy Policy, 35(1): 692–703
https://doi.org/10.1016/j.enpol.2006.01.009
25 HWinkler, T Letete, AMarquard (2013). Equitable access to sustainable development: Operationalizing key criteria. Climate Policy, 13(4): 411–432
https://doi.org/10.1080/14693062.2013.777610
26 World Bank (2015). World Bank Open Data-GDP.
27 WRI (2016). CAIT Climate Data Explore.
28 W JYi, L L Zou, J Guo, KWang, Y MWei (2011). How can china reach its CO2 intensity reduction targets by 2020? A regional allocation based on equity and development. Energy Policy, 39(5): 2407–2415
https://doi.org/10.1016/j.enpol.2011.01.063
No related articles found!
Viewed
Full text


Abstract

Cited

  Shared   
  Discussed   
版权所有 © 2015 高等教育出版社.
电话: 010-58556848 (技术); 010-58556485 (订阅) E-mail: subscribe@hep.com.cn